2013 - 35 Watergarden Dr
Listing History
Unit Highlights
Maintenance Fees
Utility Type
- Air Conditioning
- Central Air
- Heat Source
- Gas
- Heating
- Forced Air
Room Dimensions
About this Listing
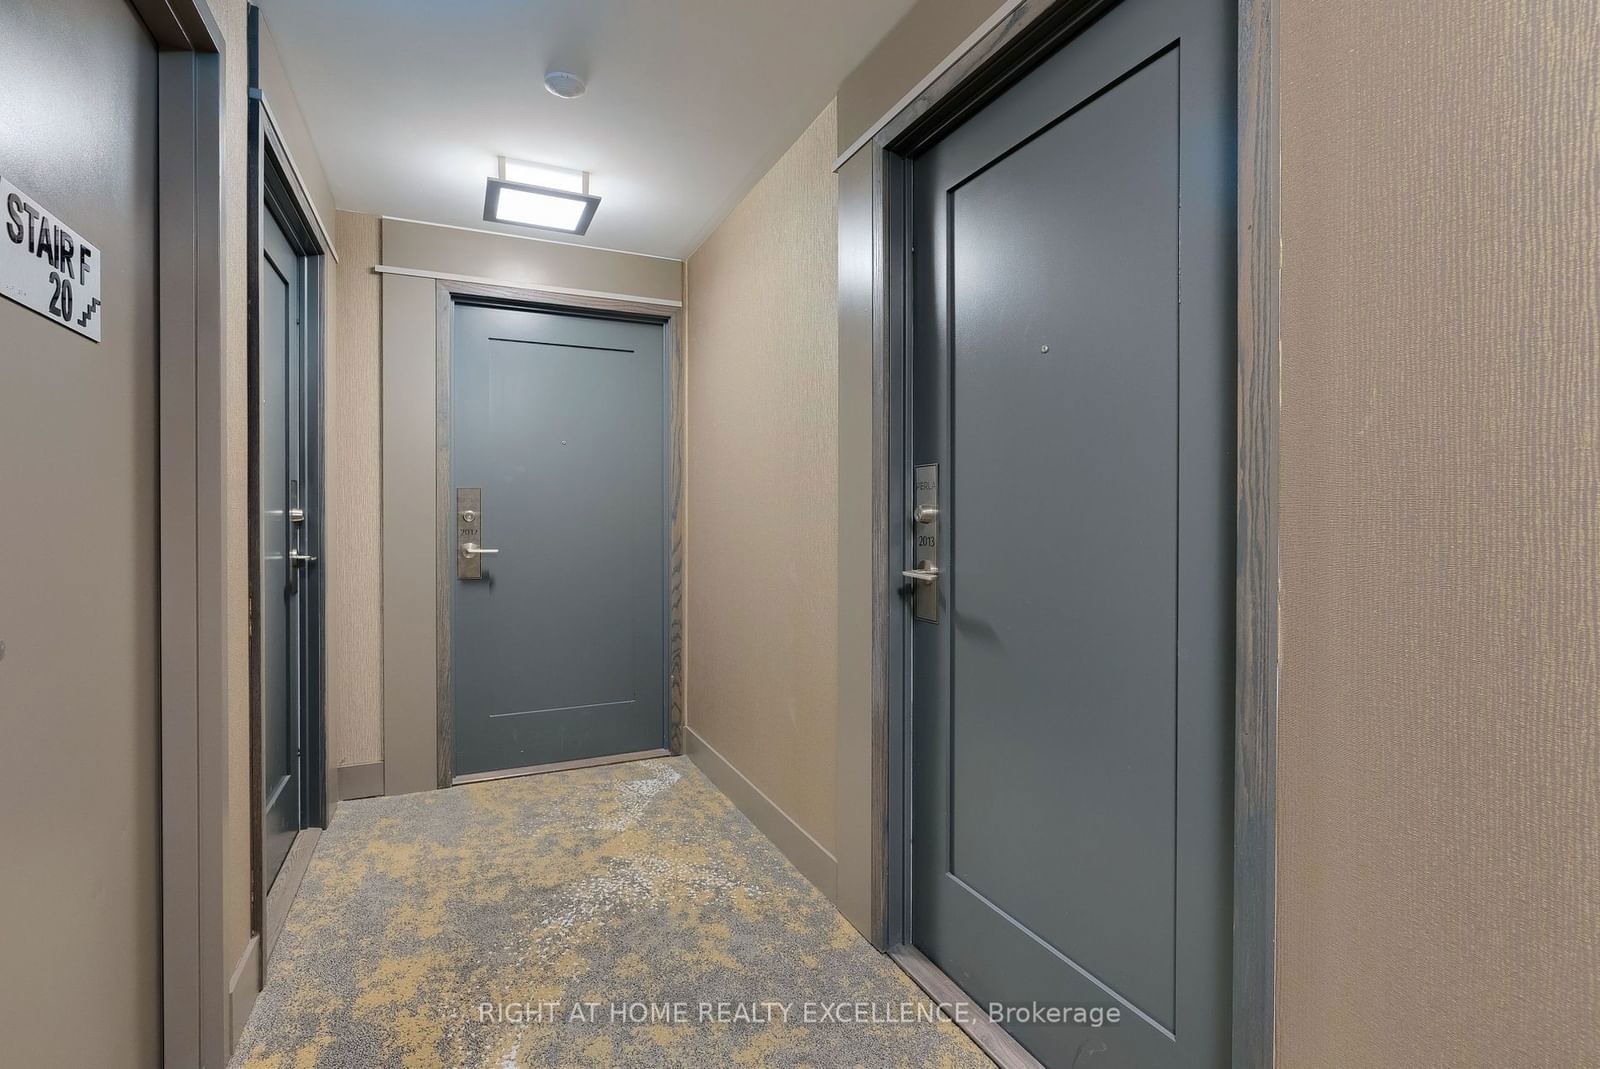
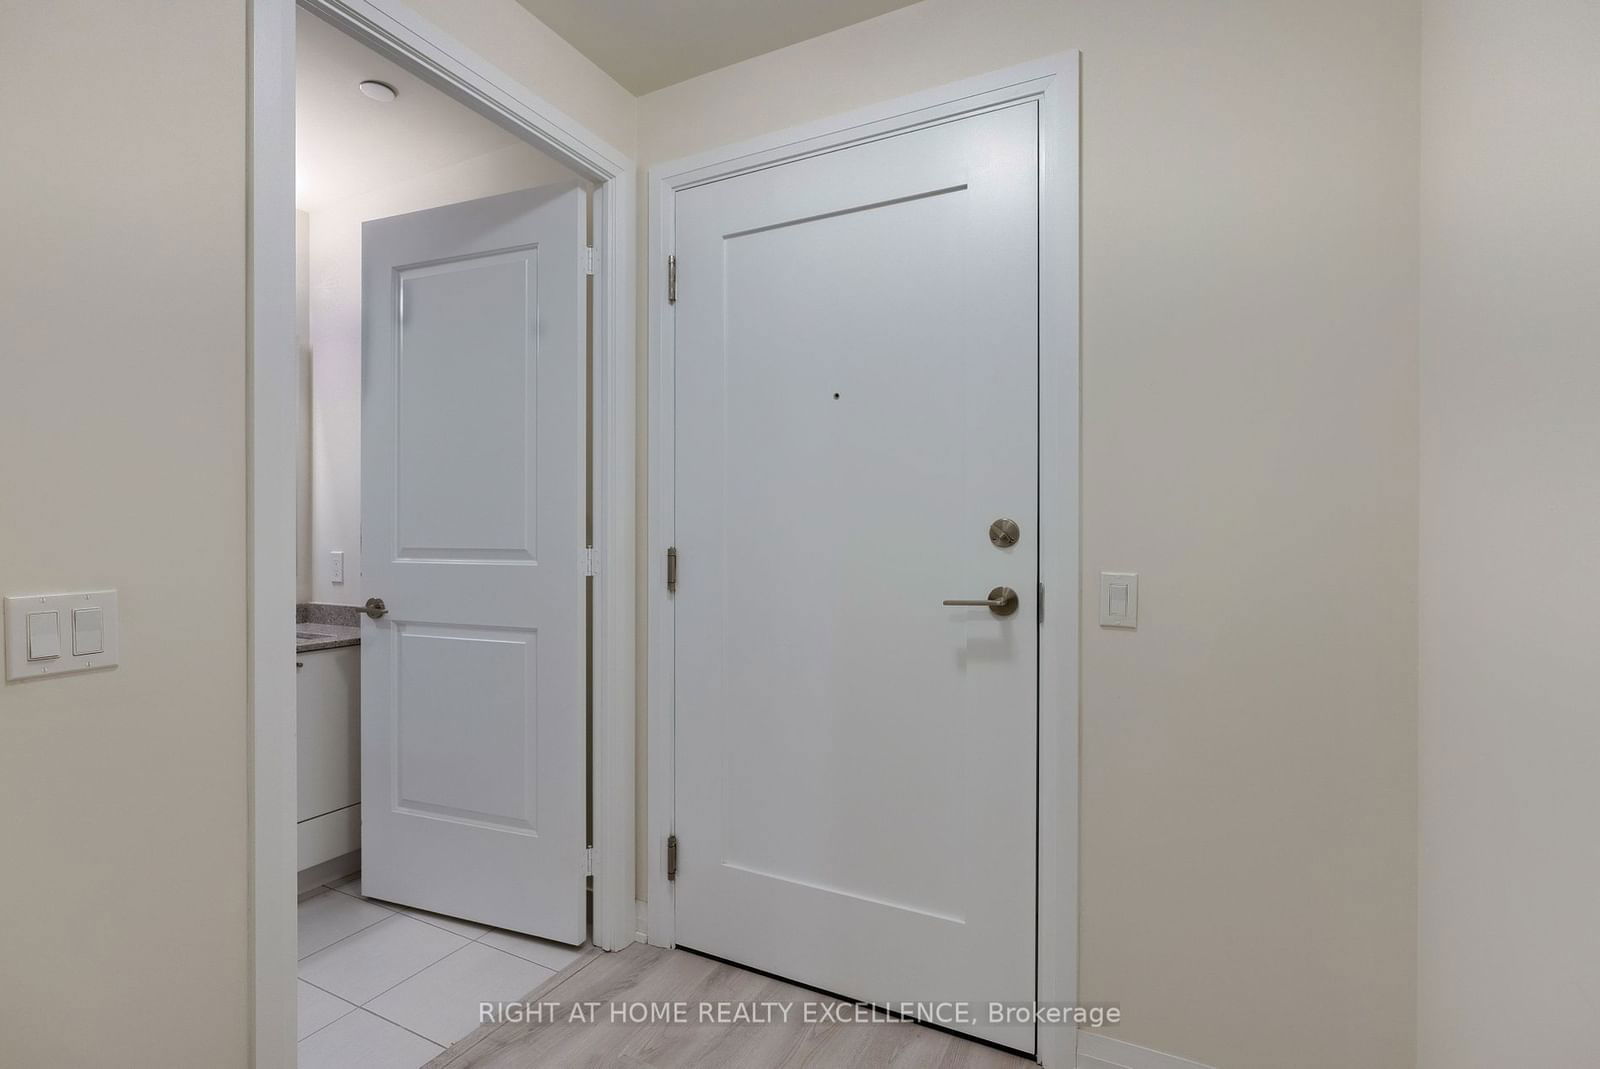
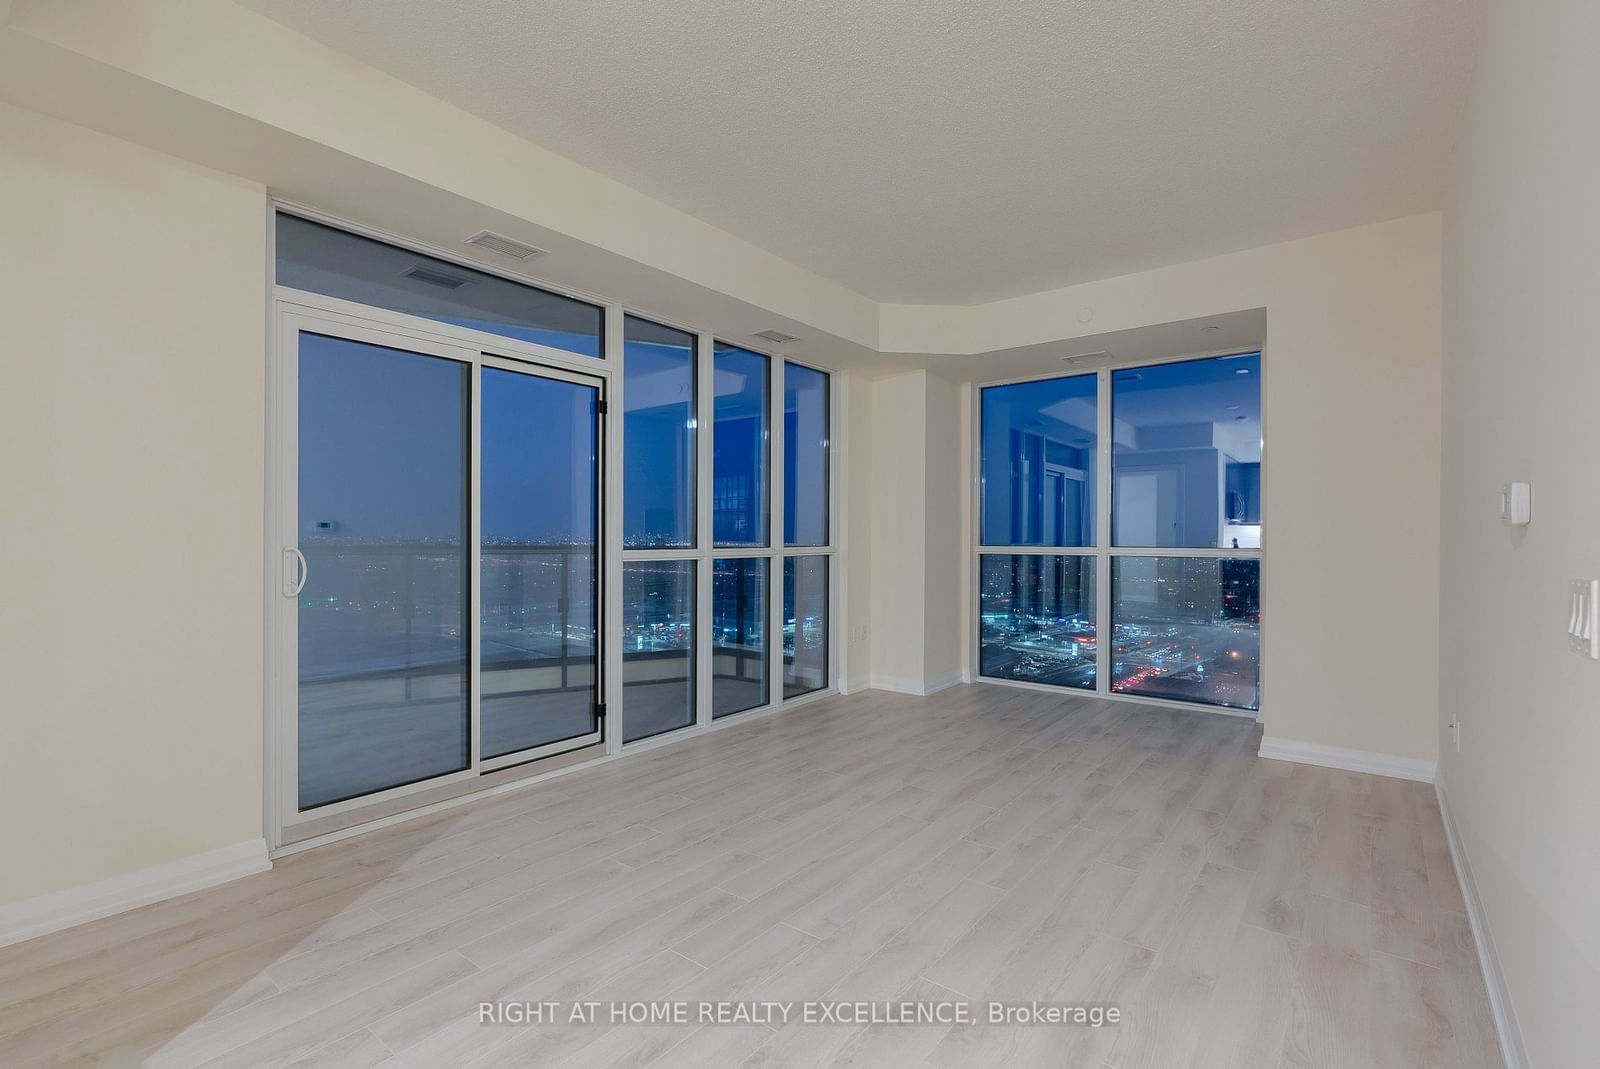
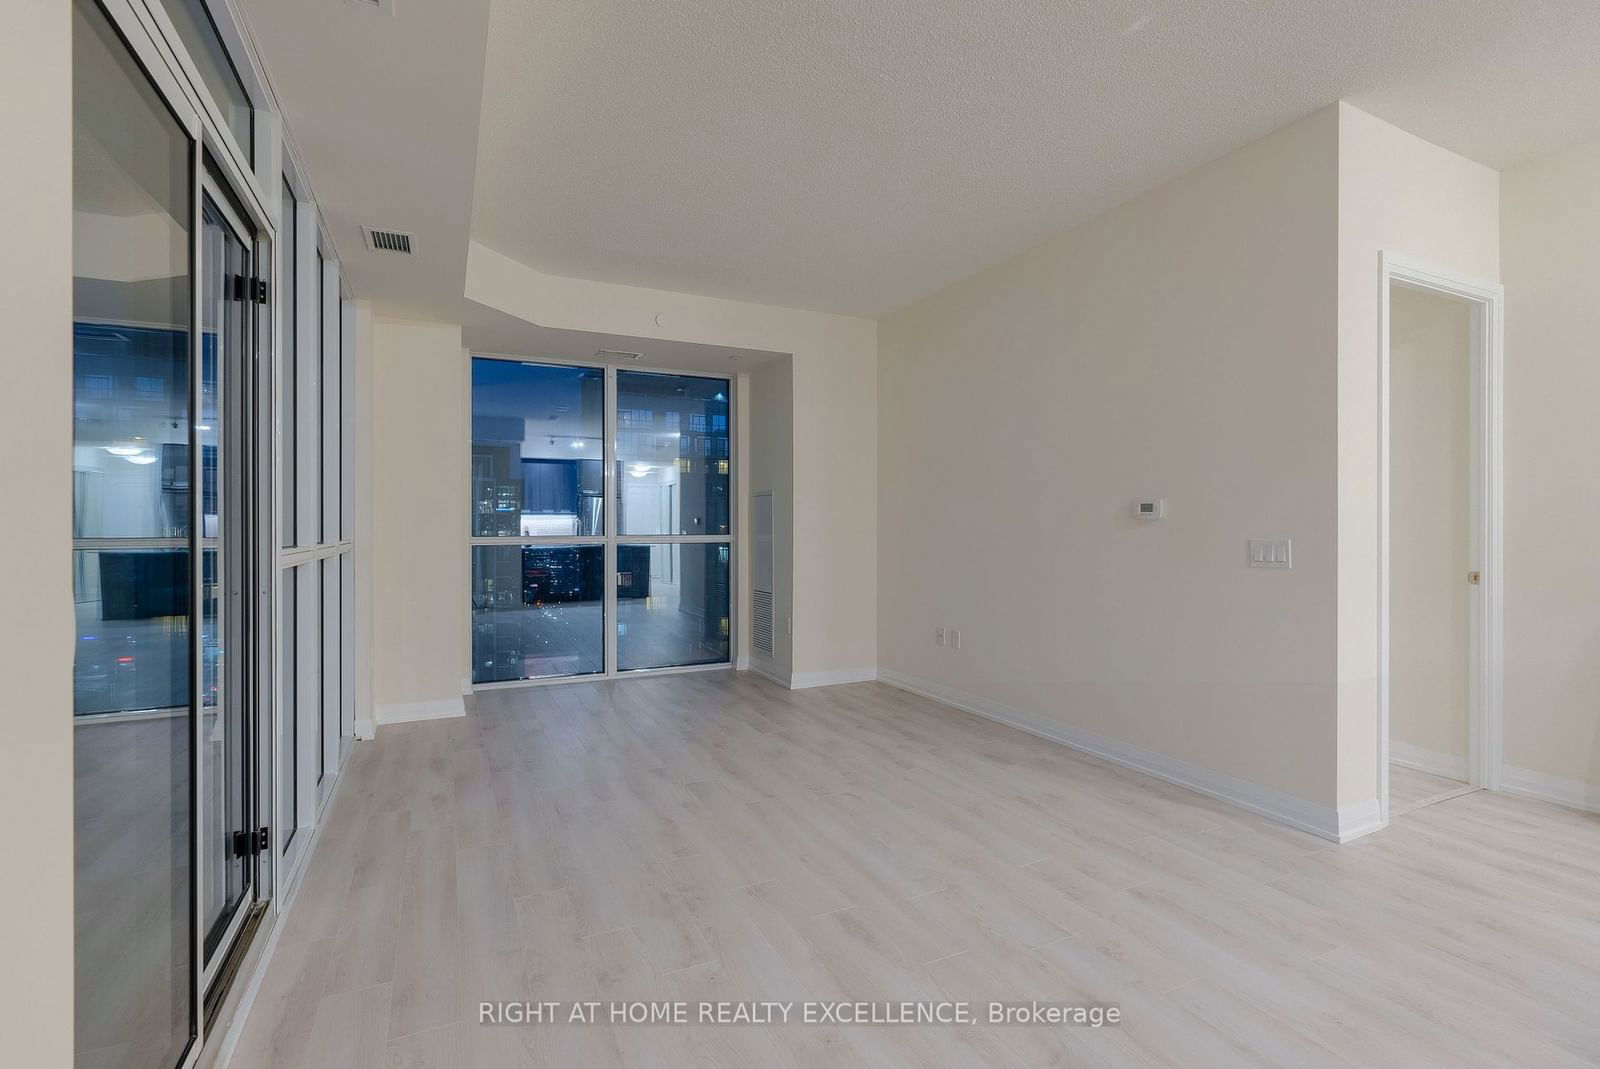
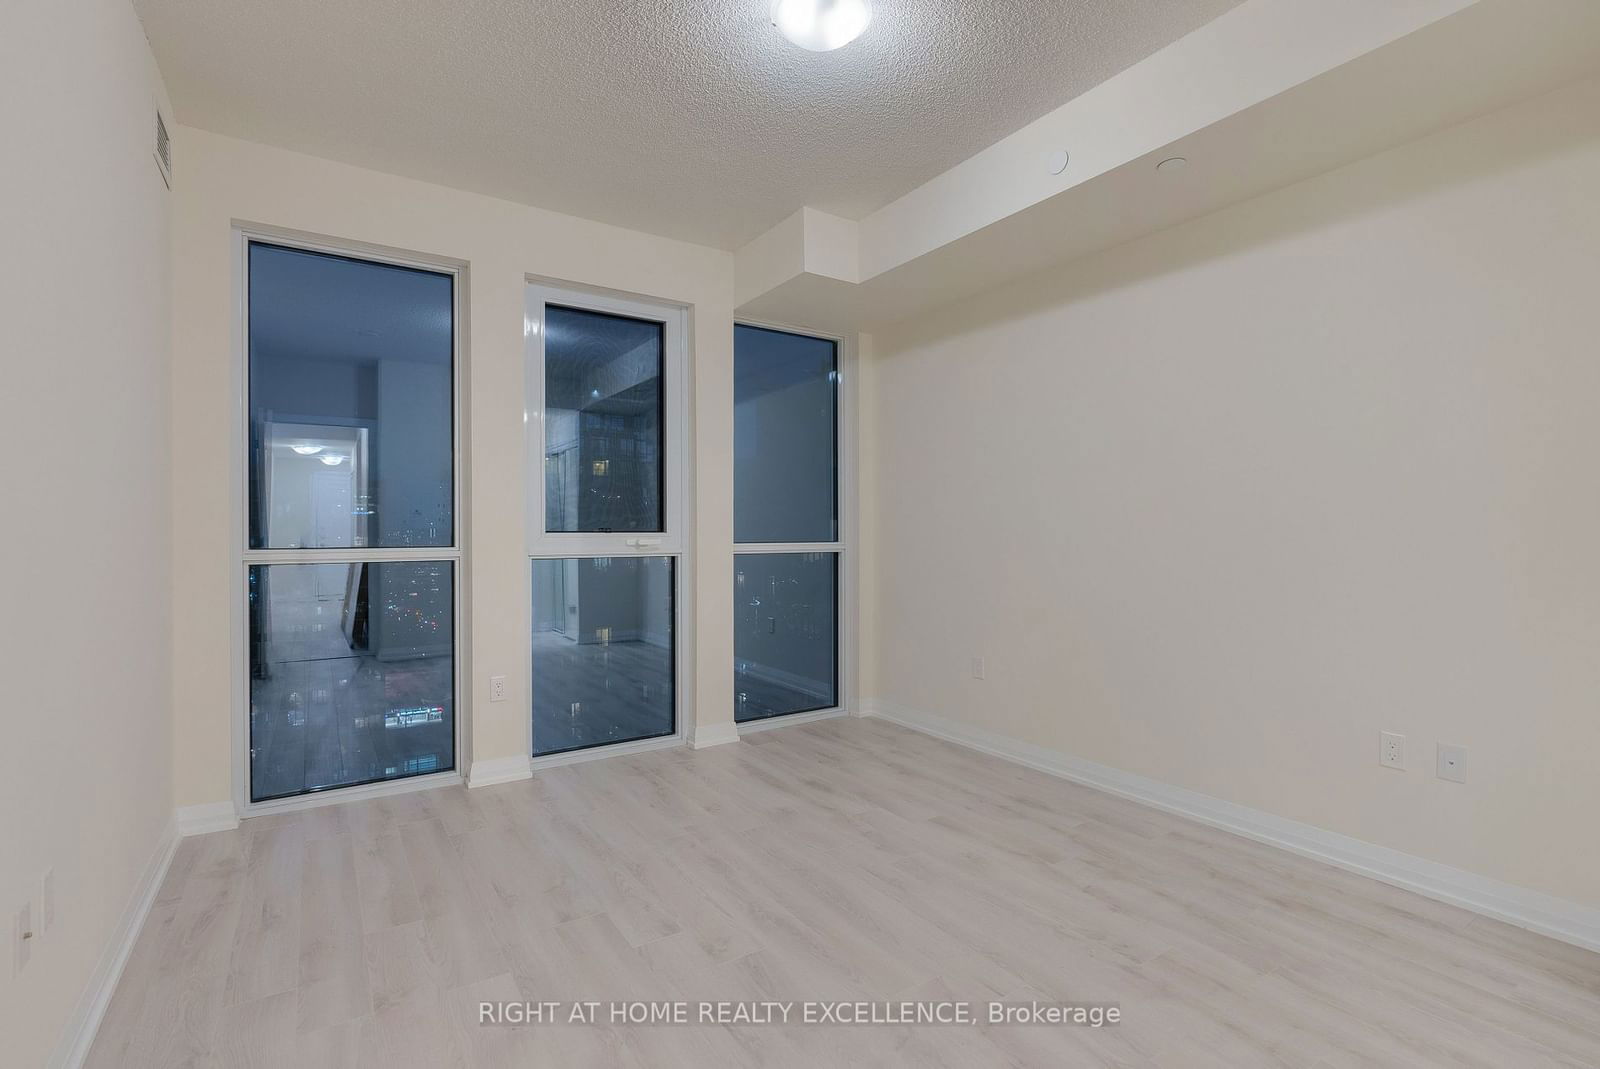
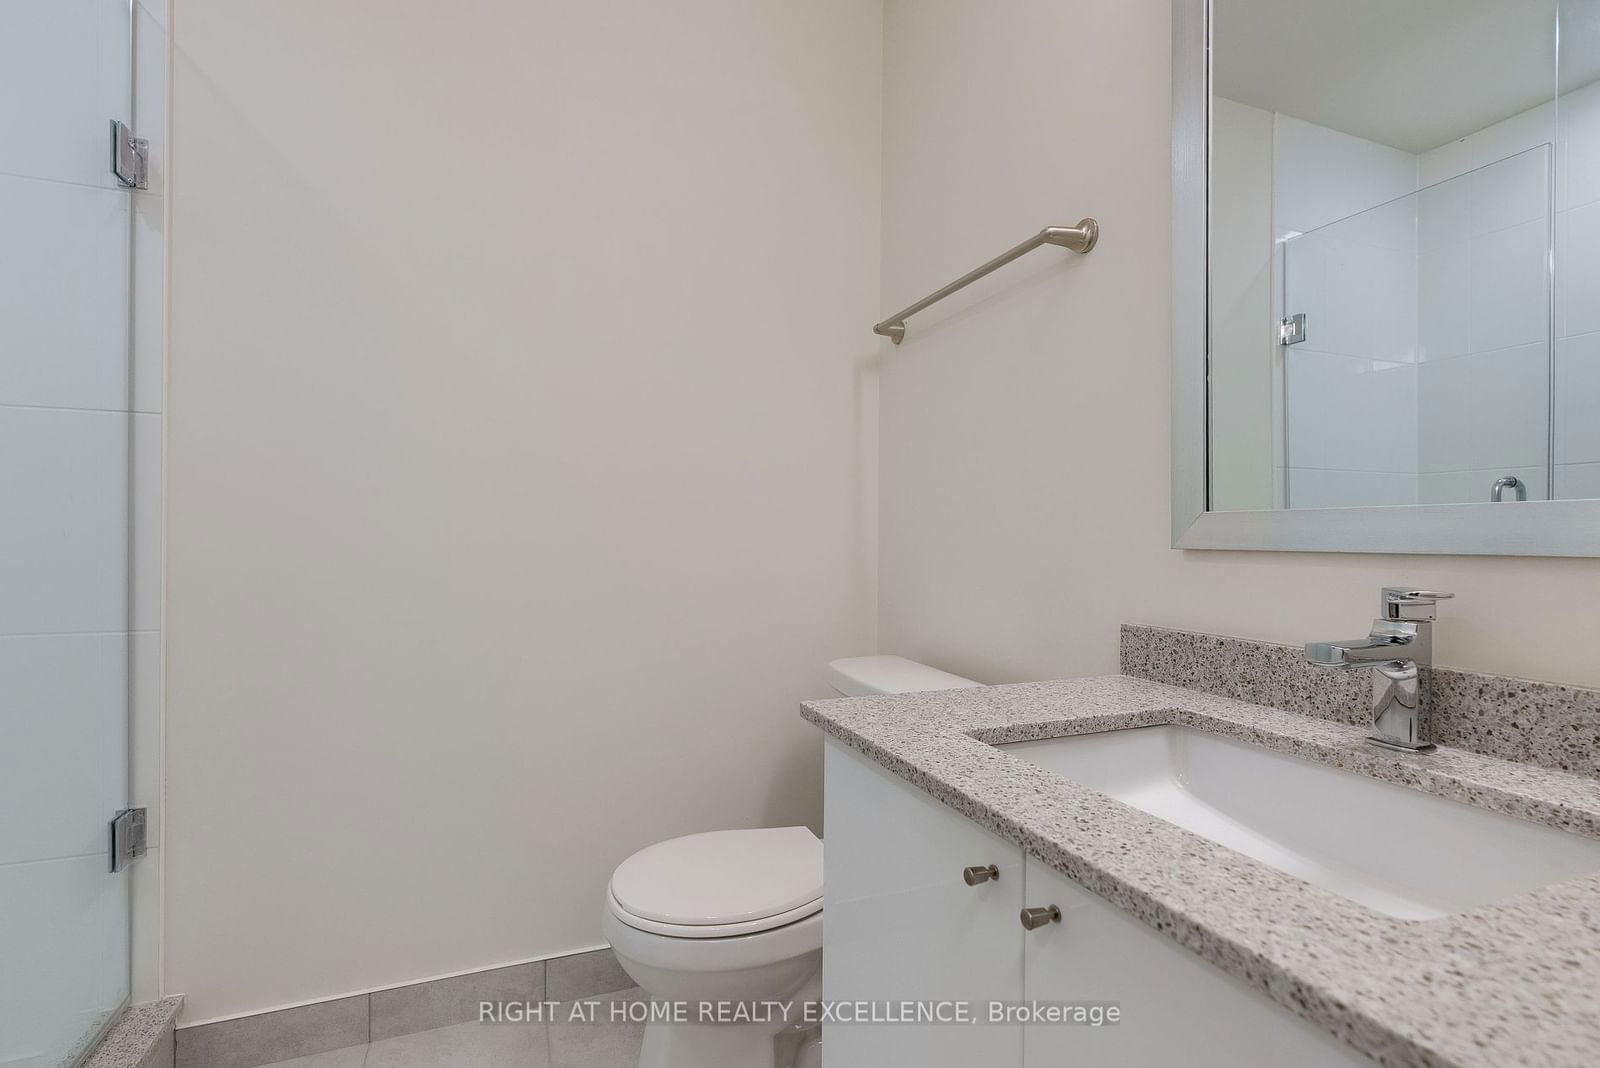
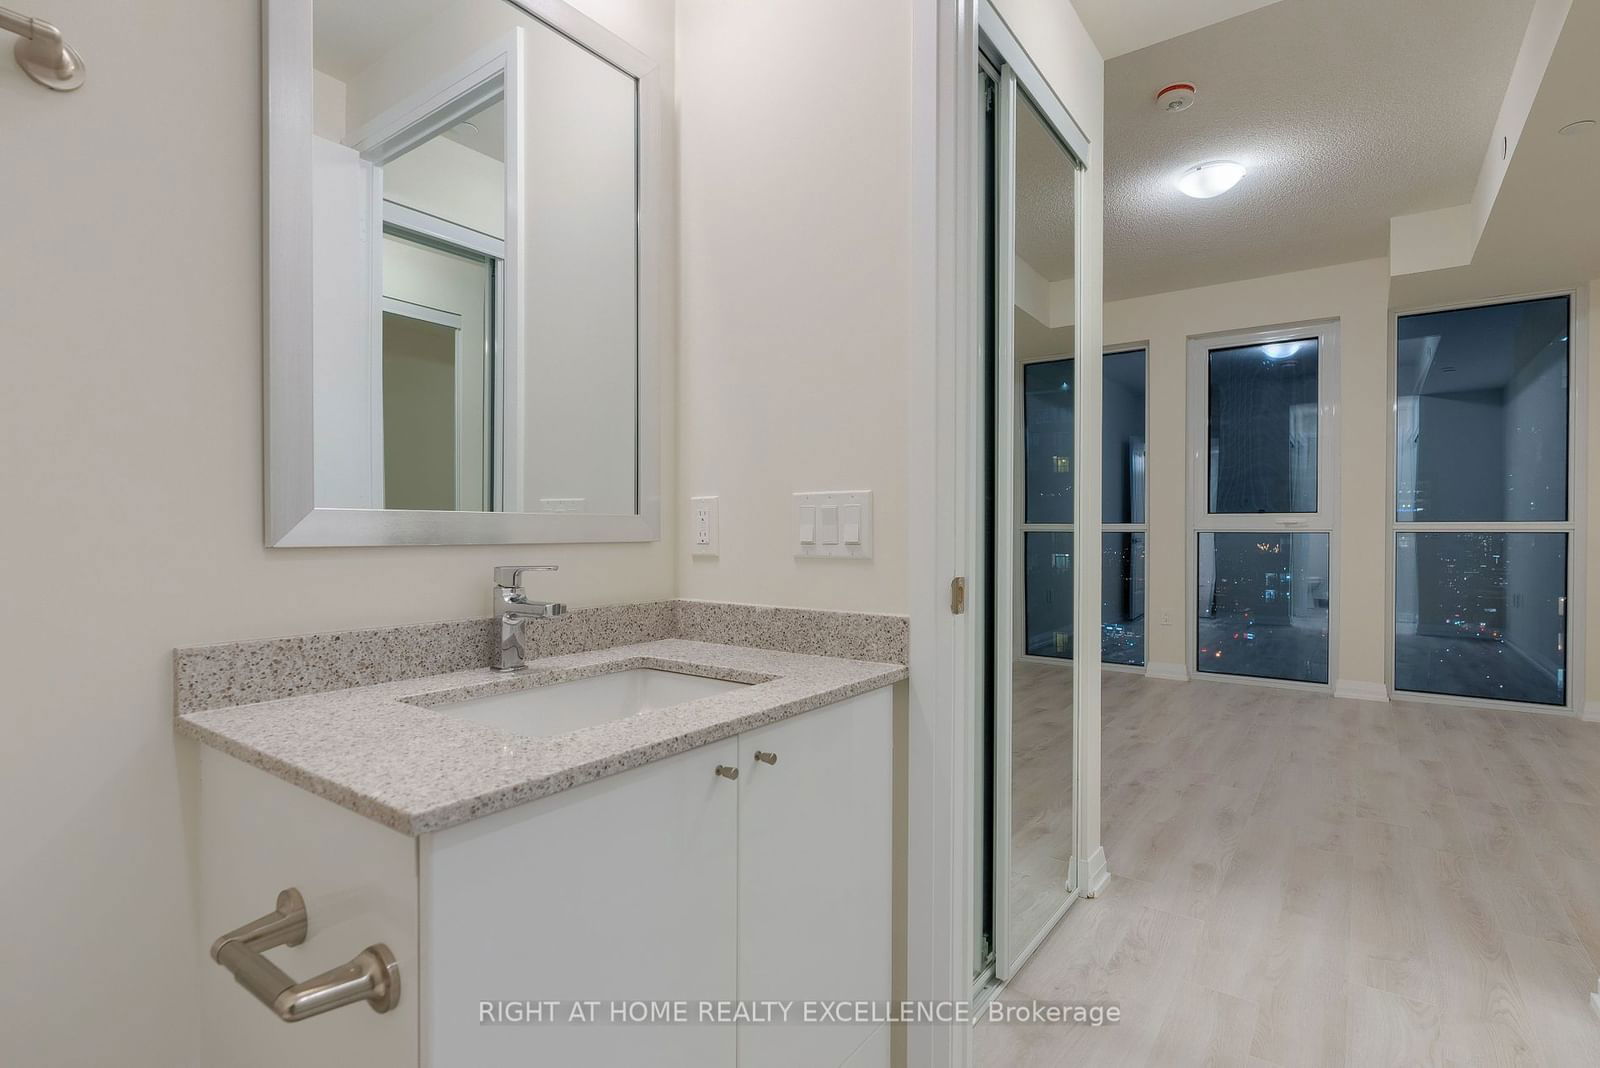
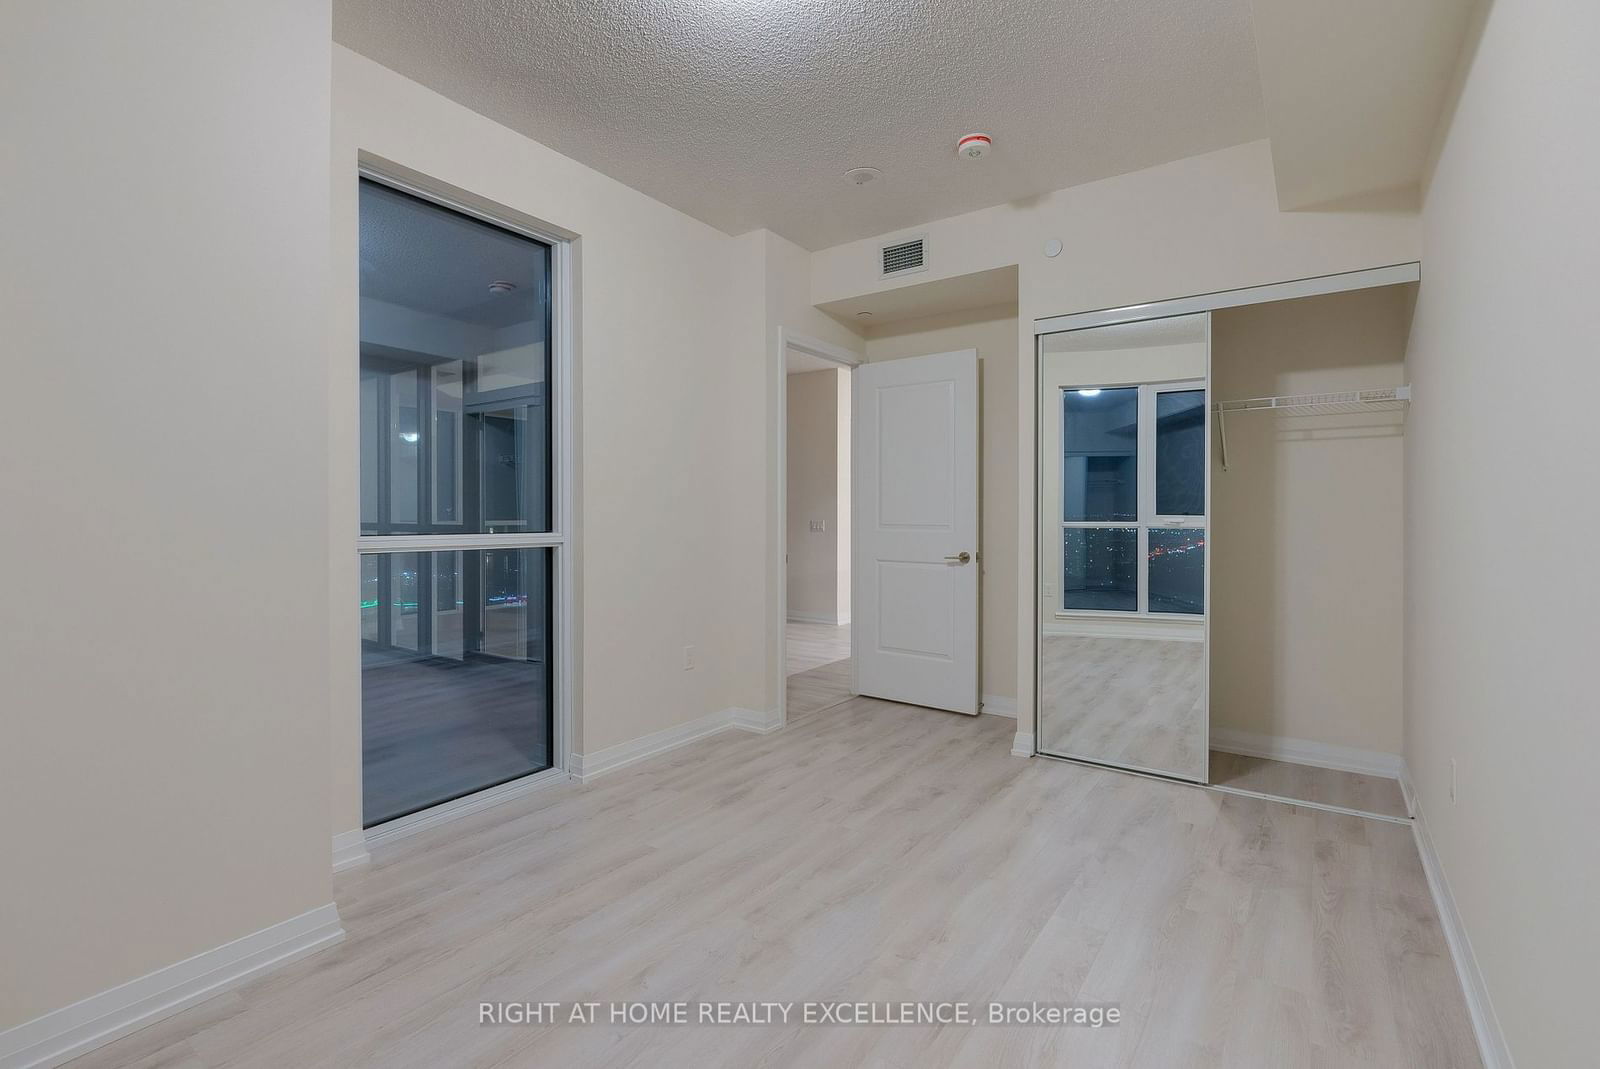
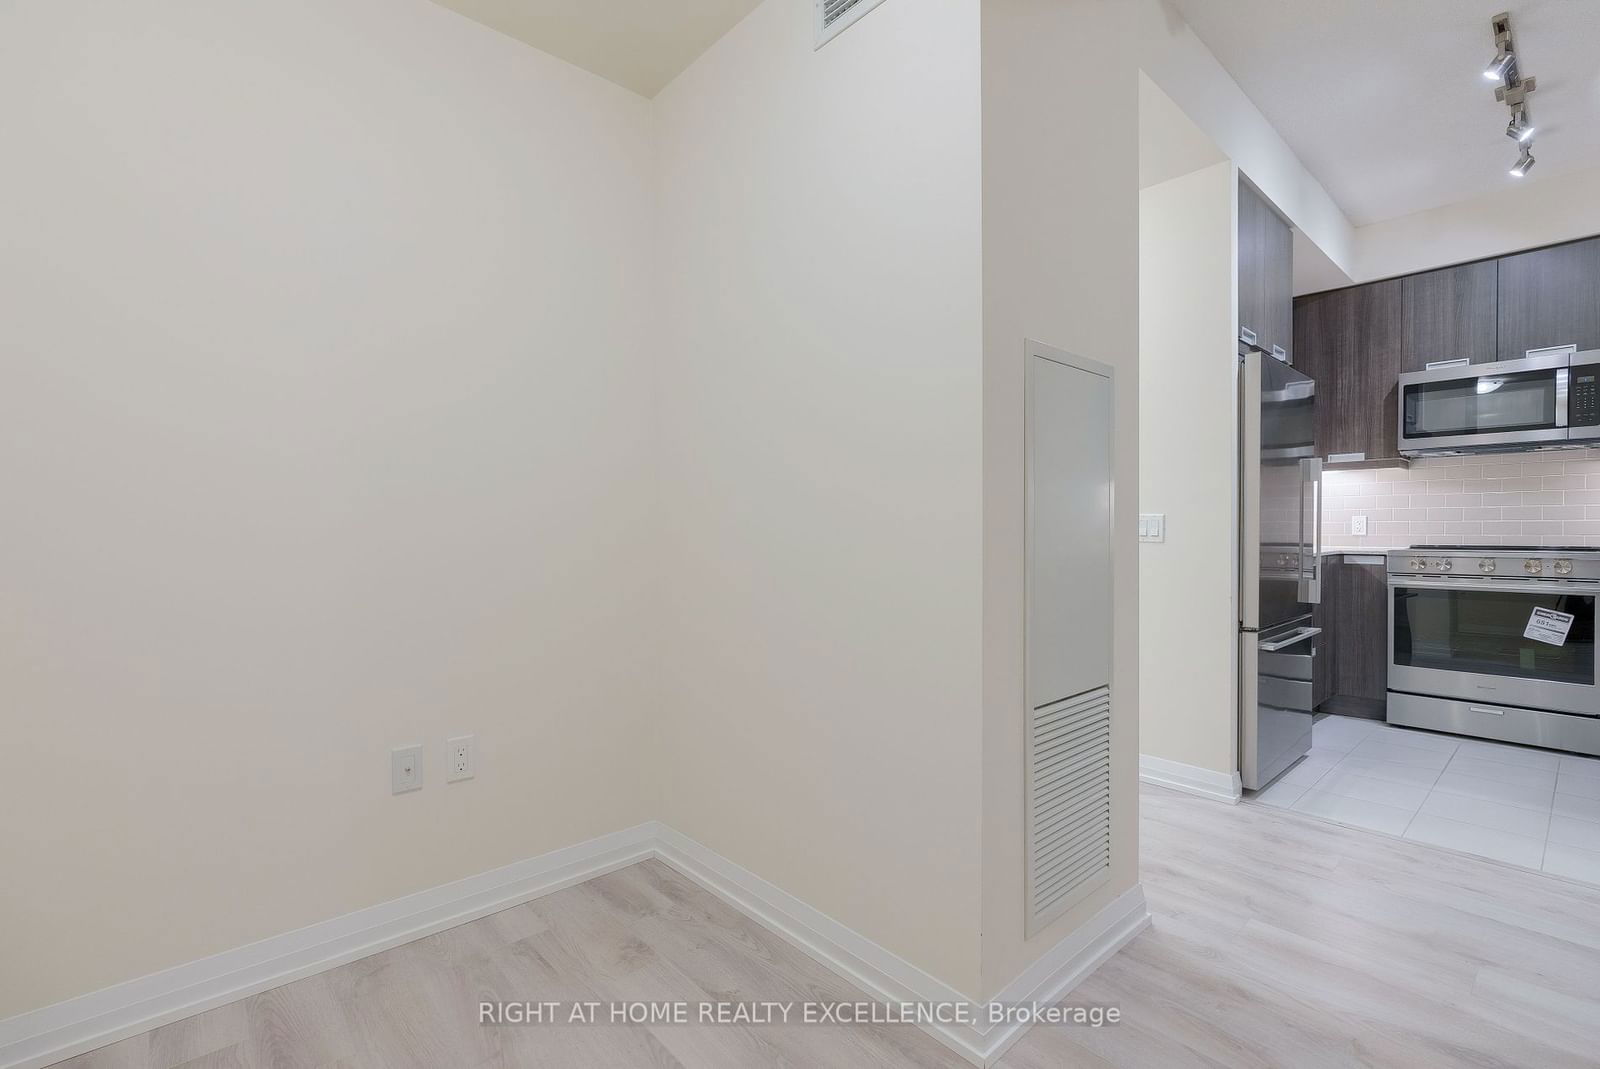
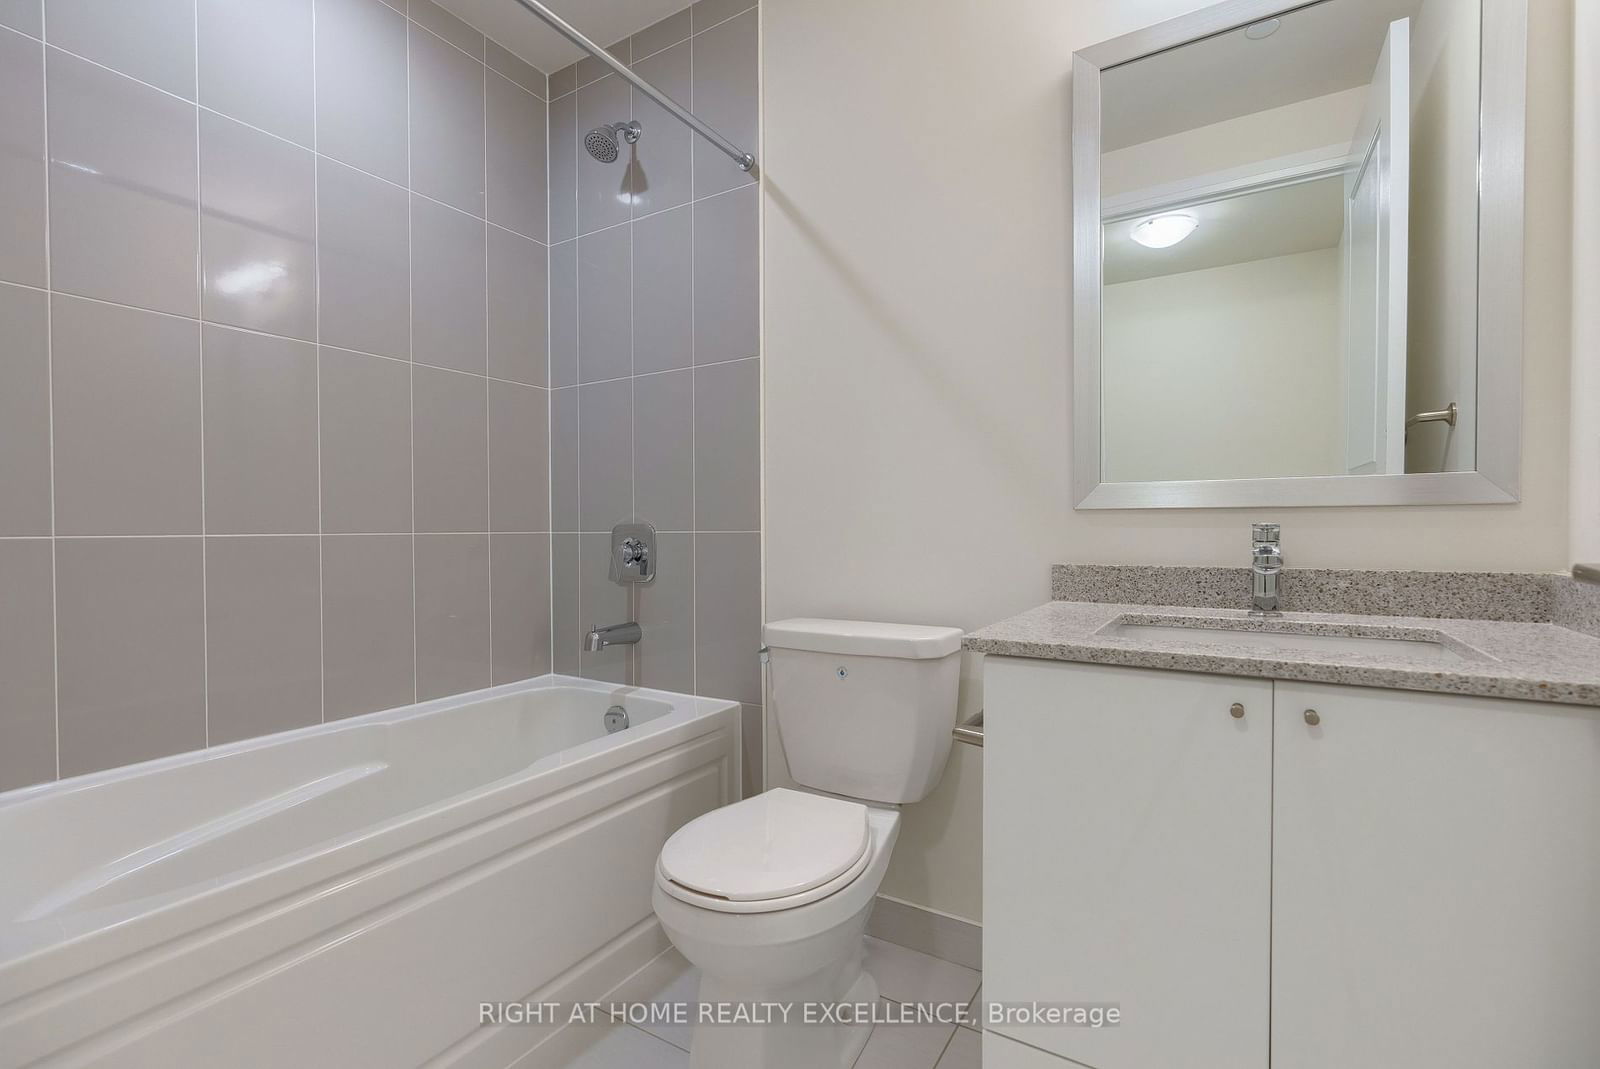
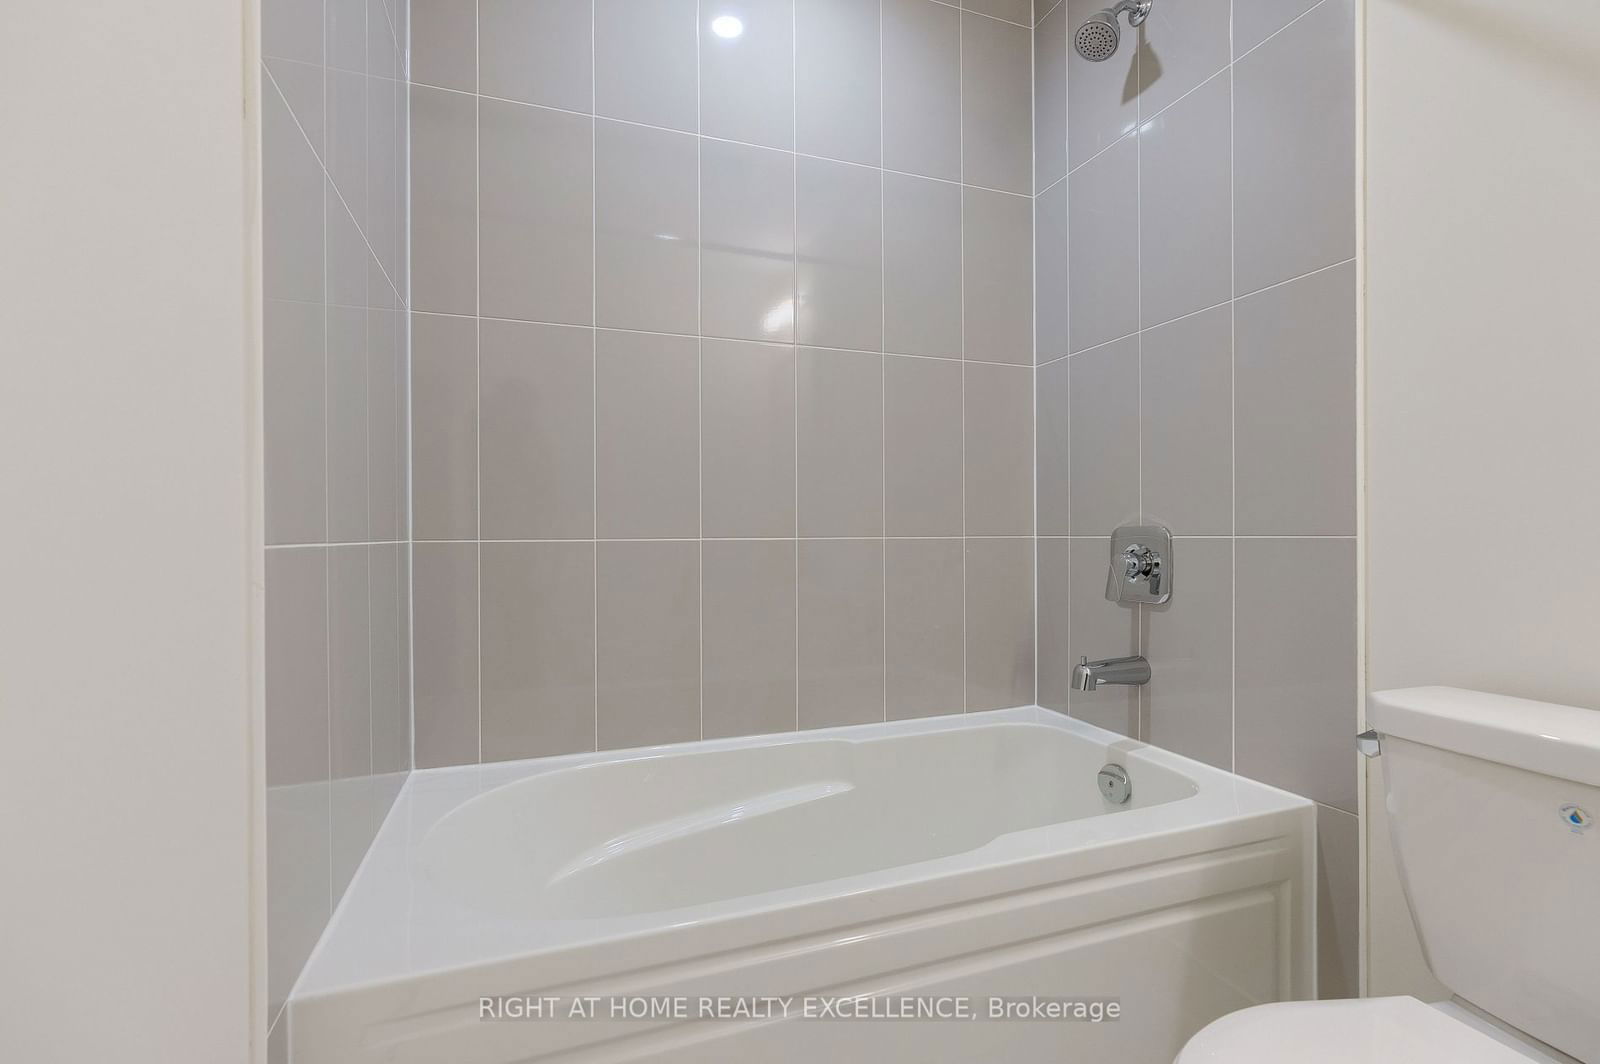
Absolutely Stunning 2 Bedroom + Den Unit offers a Generous Living Space with Unobstructed Beautiful Views, Located In The Heart Of Mississauga! High-End Kitchen With Modern Quartz Countertop & Stainless Appliances. Floor To Floor-to-ceiling windows Create Tons Of Natural Light. Perfect Den Space For The Work From Home Professionals. Walking Distance To Future Light Railway Station, Restaurant, Grocery And Transit, Excellent Facilities Including Swimming Pool, Gym, Party, Billiards, And Yoga Room, 24 Hours Security, High-Speed Ignite Internet
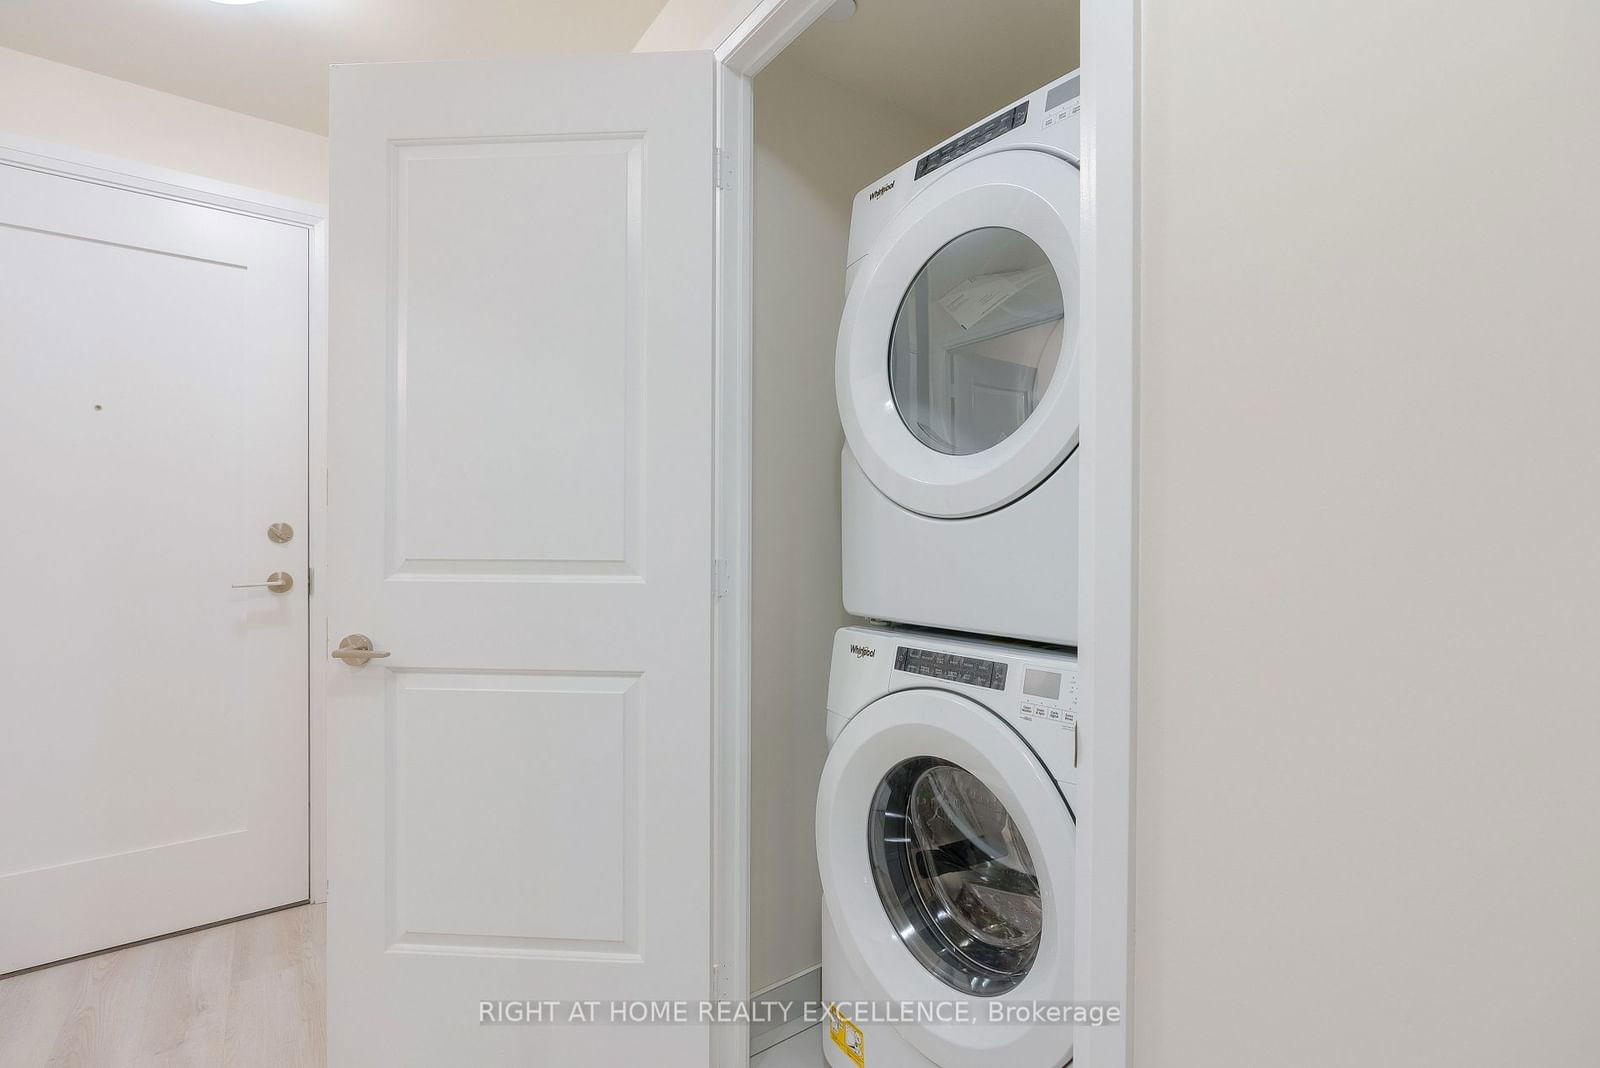
ExtrasFridge, Stove, B/I Dishwasher, B/I Microwave, And Front Load Washer & Dryer. All ELF's and Window Coverings *Pictures are taken when Property was purchased.
right at home realty excellenceMLS® #W9400223
Amenities
Explore Neighbourhood
Similar Listings
Demographics
Based on the dissemination area as defined by Statistics Canada. A dissemination area contains, on average, approximately 200 – 400 households.
Price Trends
Maintenance Fees
Building Trends At Perla Towers
Days on Strata
List vs Selling Price
Offer Competition
Turnover of Units
Property Value
Price Ranking
Sold Units
Rented Units
Best Value Rank
Appreciation Rank
Rental Yield
High Demand
Transaction Insights at 35 Watergarden Drive
| 1 Bed | 1 Bed + Den | 2 Bed | 2 Bed + Den | 3 Bed | 3 Bed + Den | |
|---|---|---|---|---|---|---|
| Price Range | $518,500 - $550,000 | $530,500 - $610,000 | No Data | $737,000 - $790,000 | No Data | No Data |
| Avg. Cost Per Sqft | $845 | $860 | No Data | $759 | No Data | No Data |
| Price Range | $2,295 - $2,650 | $2,300 - $2,600 | $2,800 - $3,250 | $2,950 - $3,500 | No Data | No Data |
| Avg. Wait for Unit Availability | 34 Days | 75 Days | No Data | 34 Days | 370 Days | No Data |
| Avg. Wait for Unit Availability | 16 Days | 28 Days | 164 Days | 10 Days | 574 Days | No Data |
| Ratio of Units in Building | 32% | 18% | 4% | 47% | 2% | 1% |
Transactions vs Inventory
Total number of units listed and sold in Hurontario


