2003 - 2221 Yonge St
Listing History
Unit Highlights
Utilities Included
Utility Type
- Air Conditioning
- Central Air
- Heat Source
- Gas
- Heating
- Forced Air
Room Dimensions
About this Listing
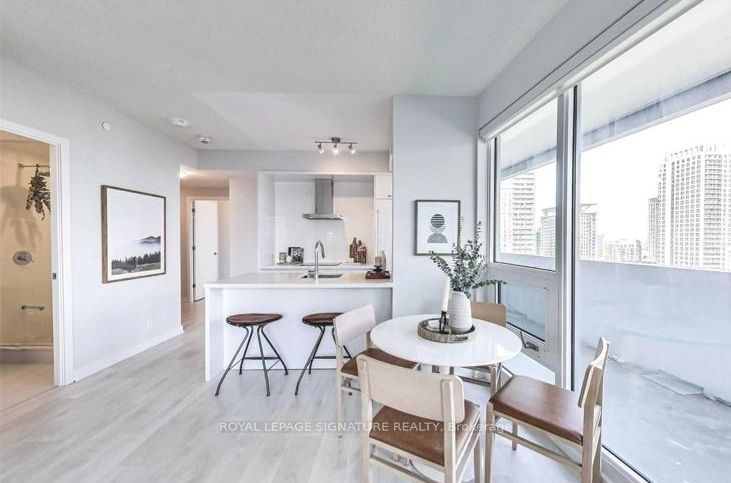
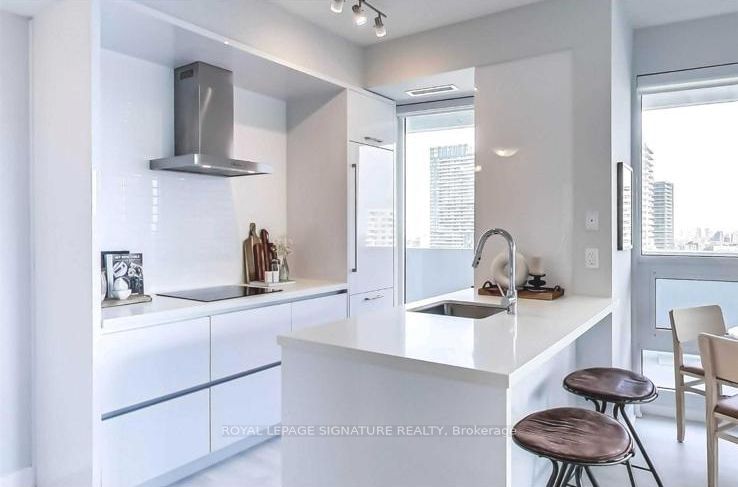
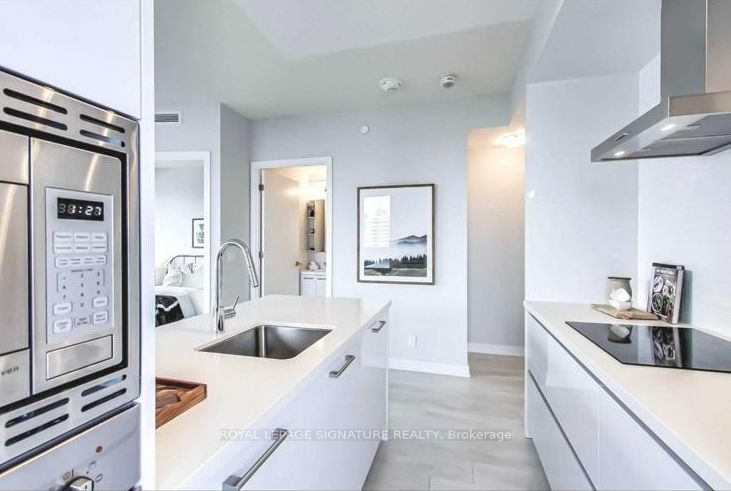
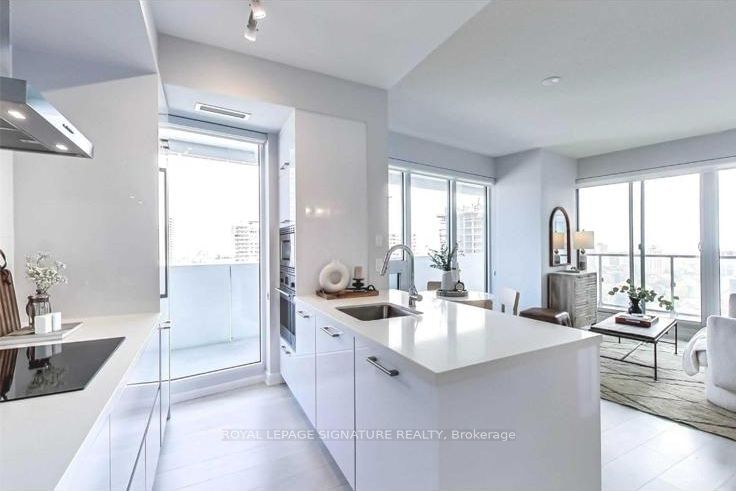
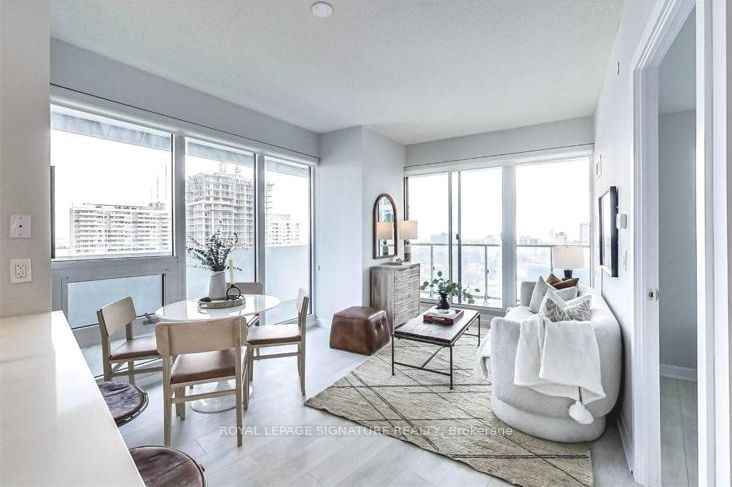
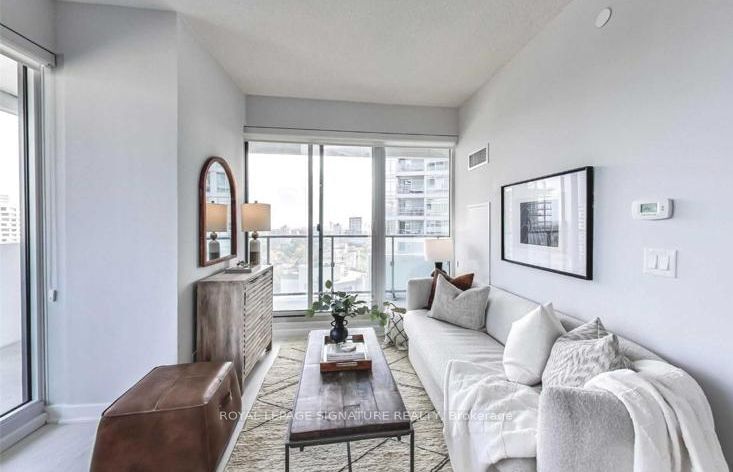
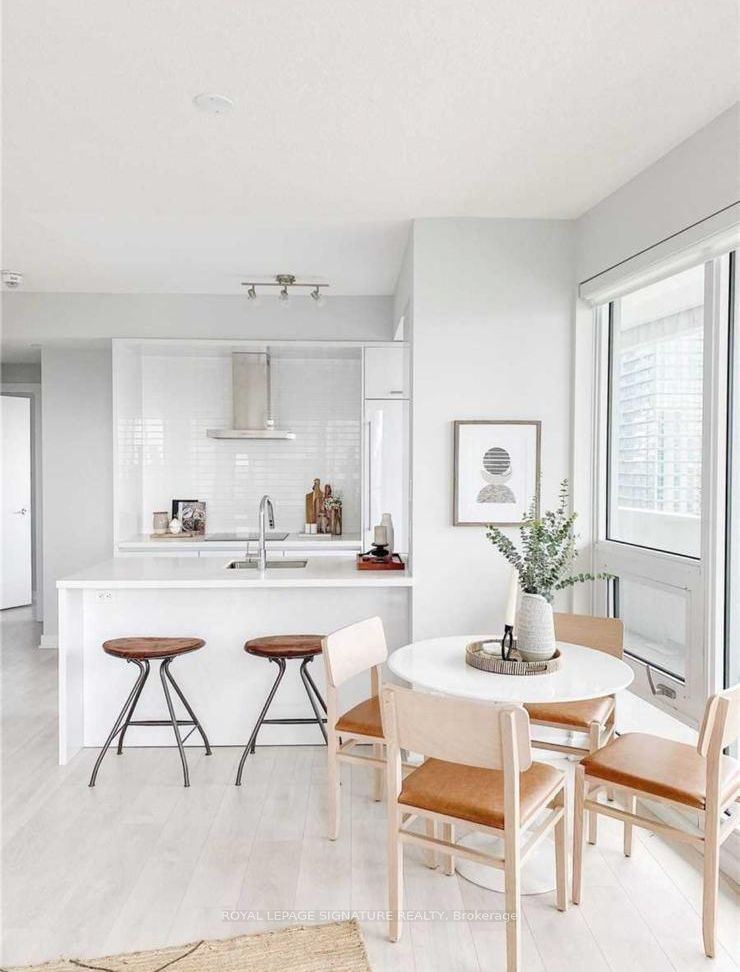
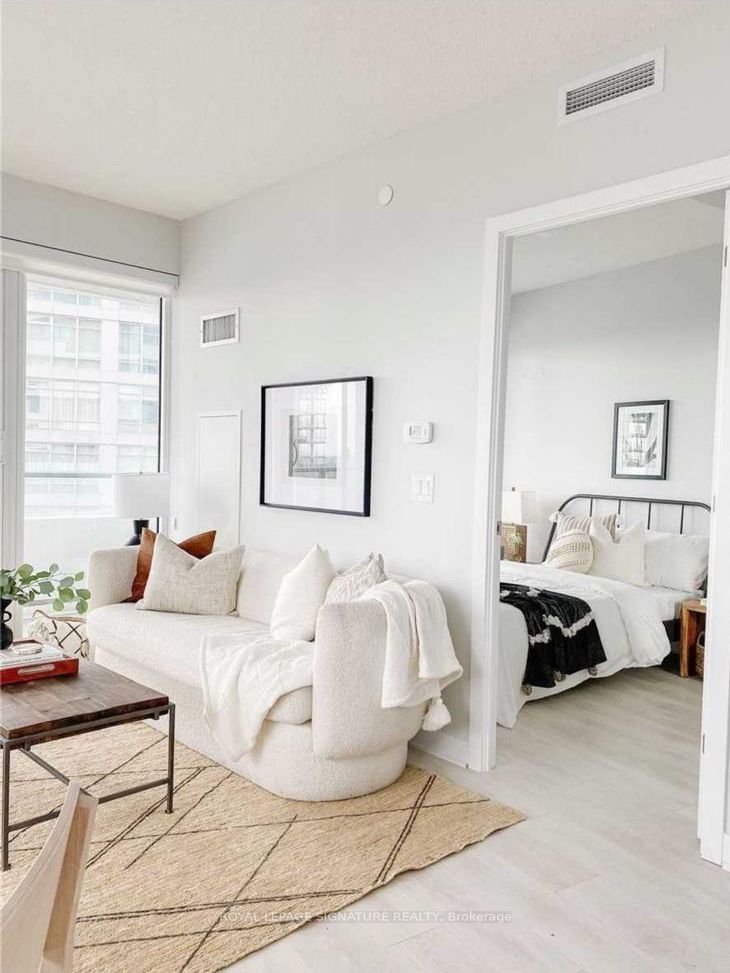
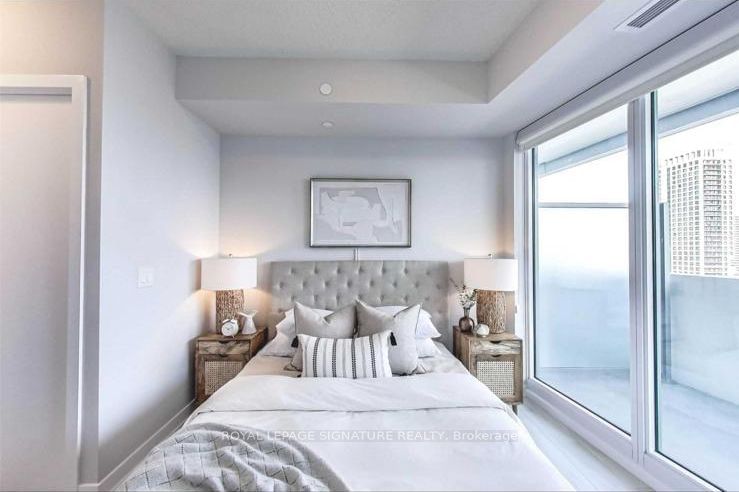
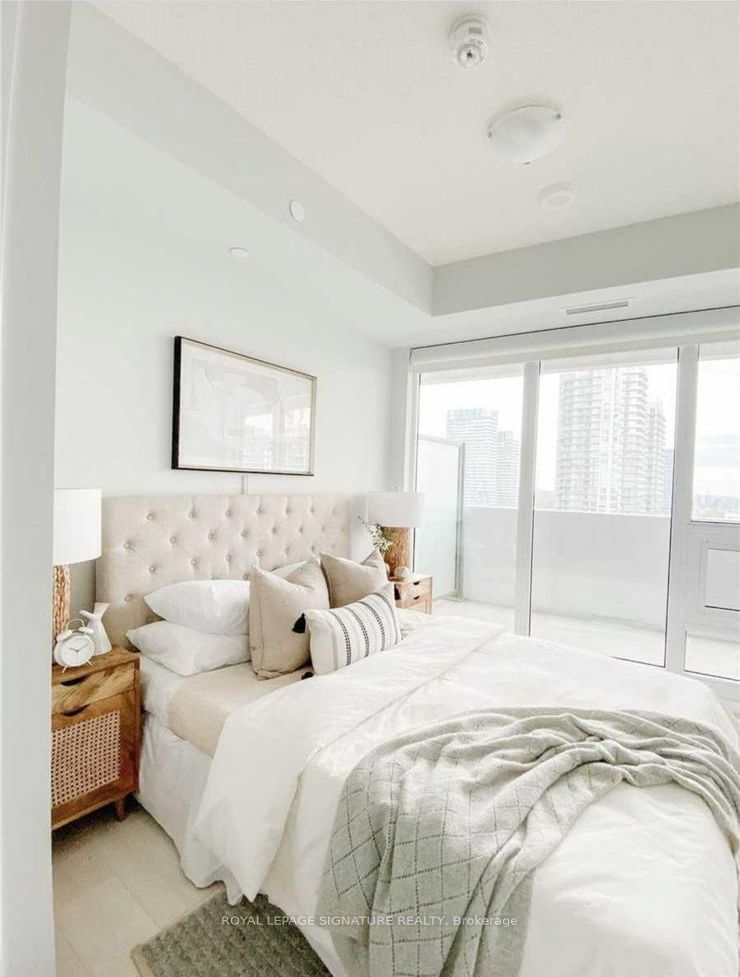
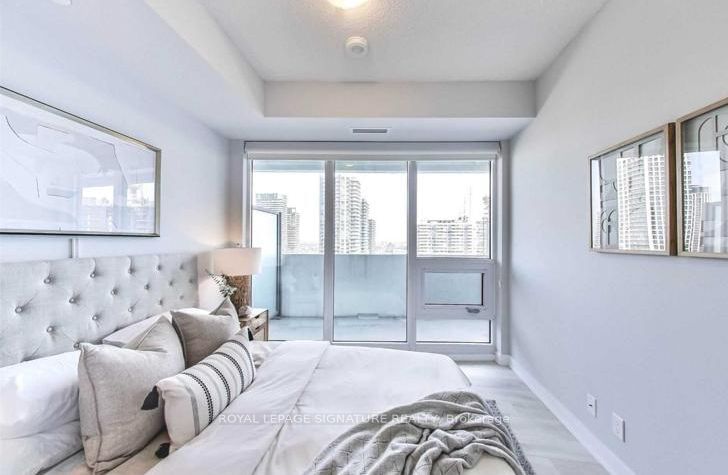
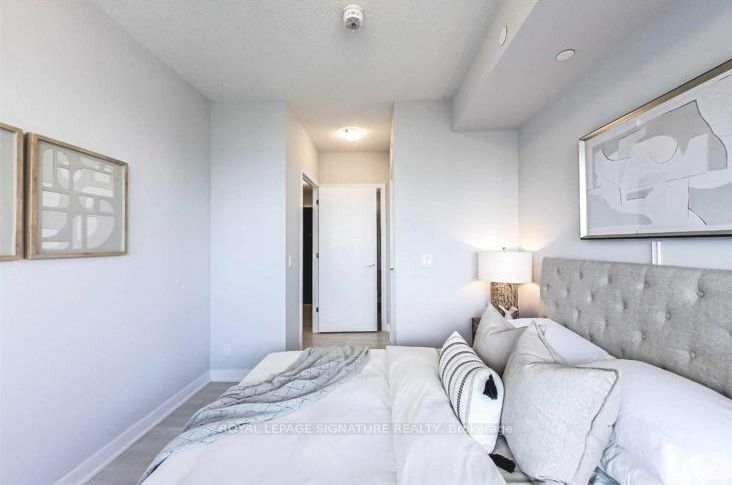
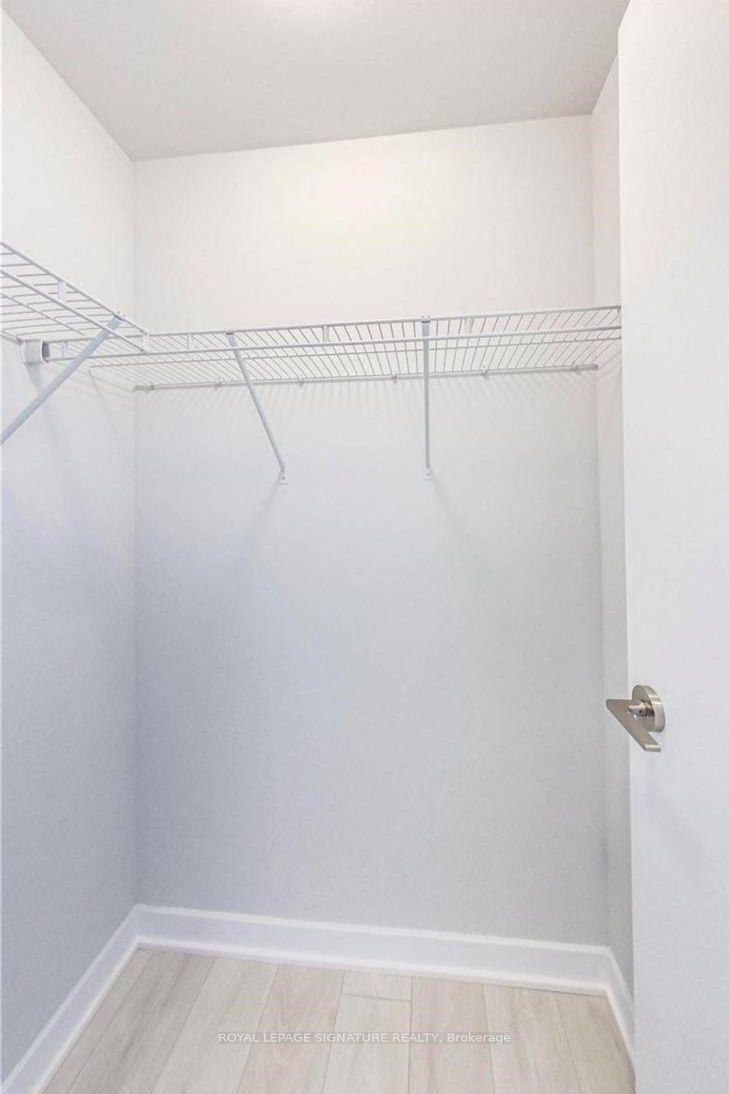
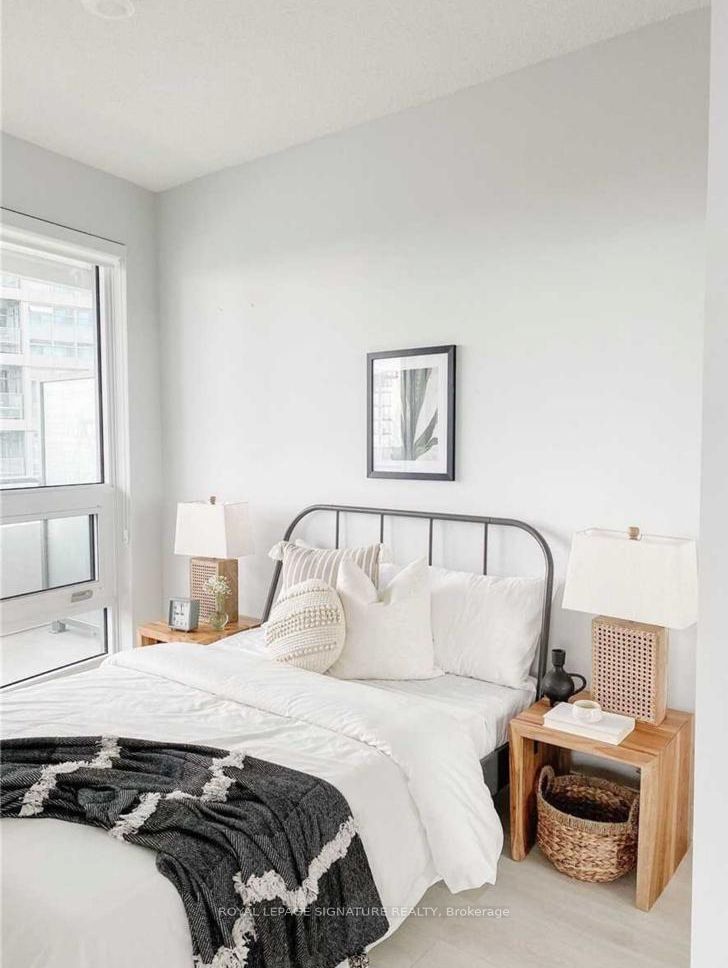
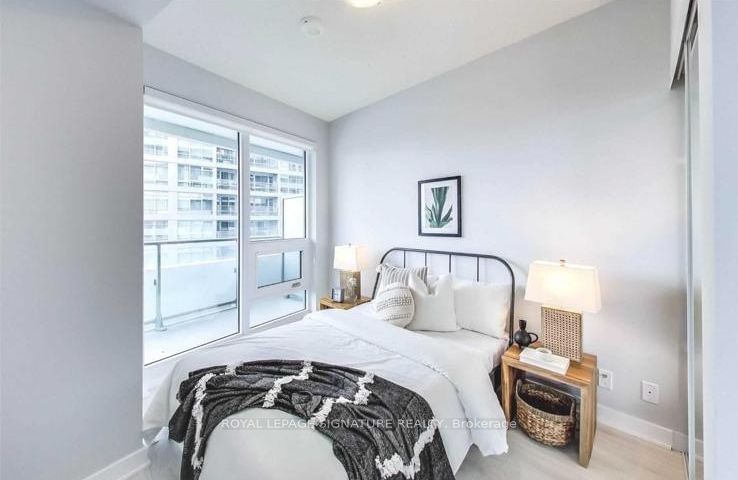
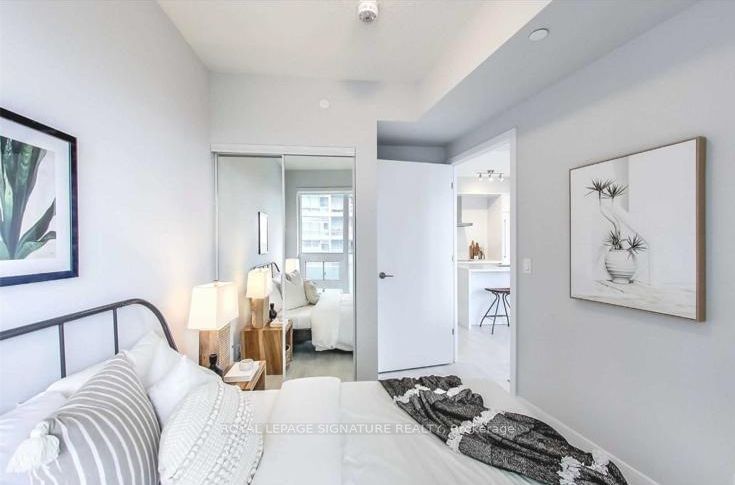
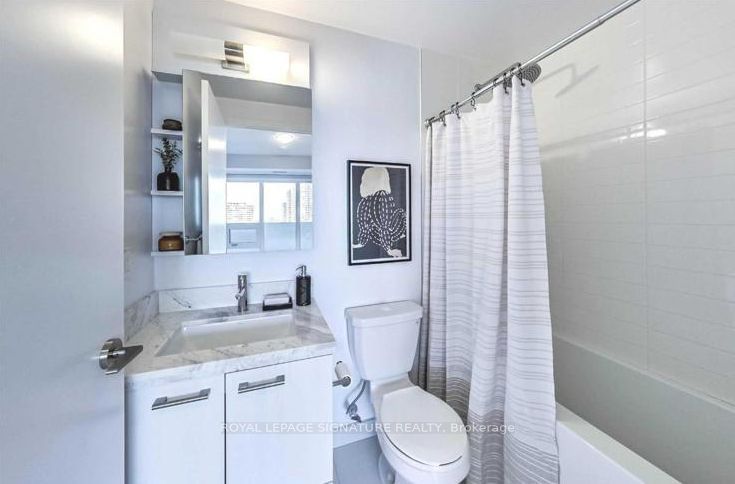
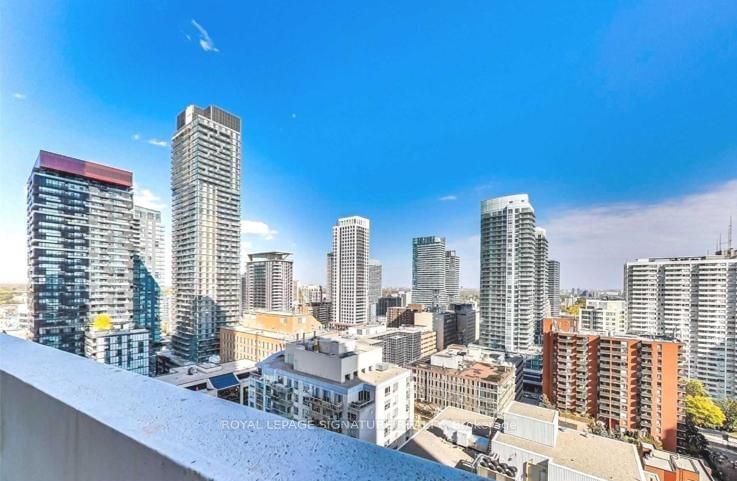
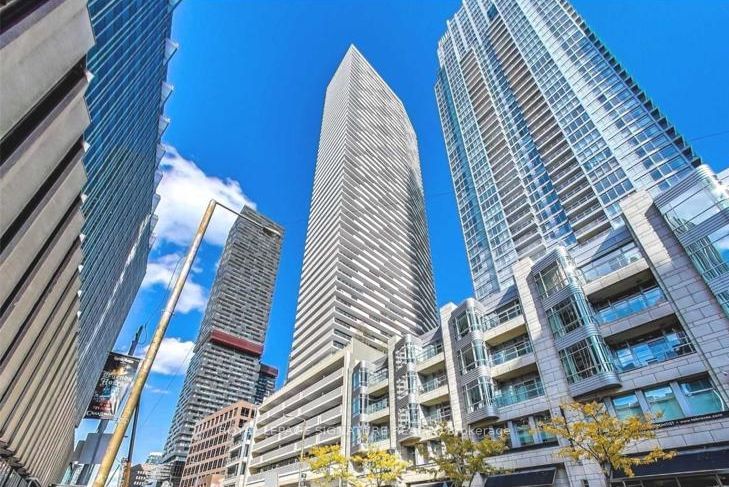
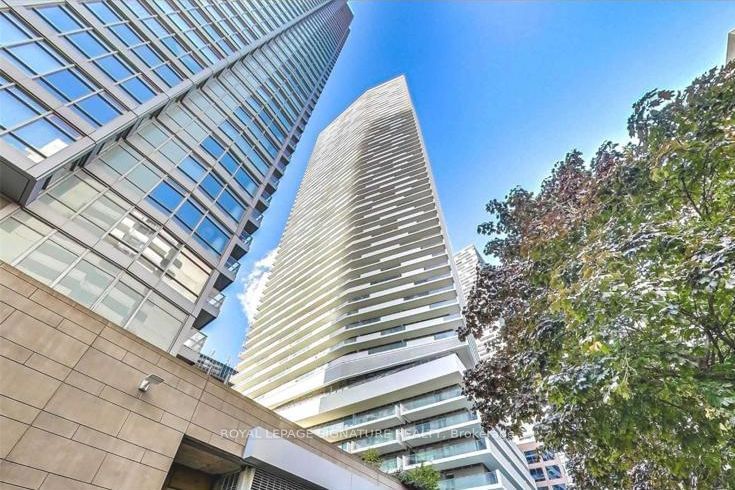
2 Bed/2 Bath Corner Unit In Prime Midtown Toronto! Over 1083 Of Open-Concept Living Space (738 Int +311 Wrap-Around Balcony) and SE City Views! Modern European Kitchen, Island Breakfast Bar, Quartz Countertop, Ceramic Backsplash, High-End Appliances, Floor To Ceiling Windows, 9 Ft Ceiling, Wide Plank Laminate Flooring, Spacious Closet, Excellent Amenities Incl: Rooftop Loung w/Bar & Fireplace,Yoga/Gym Room, Indoor Pool, Sauna, Games/Billiards Room, Theatre, Guest Suites, 24 Hour Concierge.Easy Walk To Shops, Theatre, Banks, Restaurants And Groceries And Just Steps To TTC Yonge Line And Eglinton Crosstown LRT For Everything Else. No Car Required!
ExtrasTop Of The Line Appliances, Stainless Steel Fridge, Cooktop Stove, Built-In Oven, Built-In Microwave, Hood Fan, Dishwasher, Washer And Dryer, All Electric Light Fixtures, All Window Coverings.
royal lepage signature realtyMLS® #C11910875
Amenities
Explore Neighbourhood
Similar Listings
Demographics
Based on the dissemination area as defined by Statistics Canada. A dissemination area contains, on average, approximately 200 – 400 households.
Price Trends
Maintenance Fees
Building Trends At 2221 Yonge Condos
Days on Strata
List vs Selling Price
Offer Competition
Turnover of Units
Property Value
Price Ranking
Sold Units
Rented Units
Best Value Rank
Appreciation Rank
Rental Yield
High Demand
Transaction Insights at 2221 Yonge Street
| 1 Bed | 1 Bed + Den | 2 Bed | 3 Bed | |
|---|---|---|---|---|
| Price Range | $530,000 - $695,000 | $560,000 - $630,000 | $699,000 - $850,000 | No Data |
| Avg. Cost Per Sqft | $1,129 | $969 | $1,065 | No Data |
| Price Range | $2,050 - $2,600 | $2,250 - $2,600 | $2,800 - $3,495 | $3,450 - $3,600 |
| Avg. Wait for Unit Availability | 50 Days | 72 Days | 32 Days | No Data |
| Avg. Wait for Unit Availability | 4 Days | 7 Days | 8 Days | 203 Days |
| Ratio of Units in Building | 46% | 28% | 26% | 1% |
Transactions vs Inventory
Total number of units listed and leased in Mount Pleasant West
