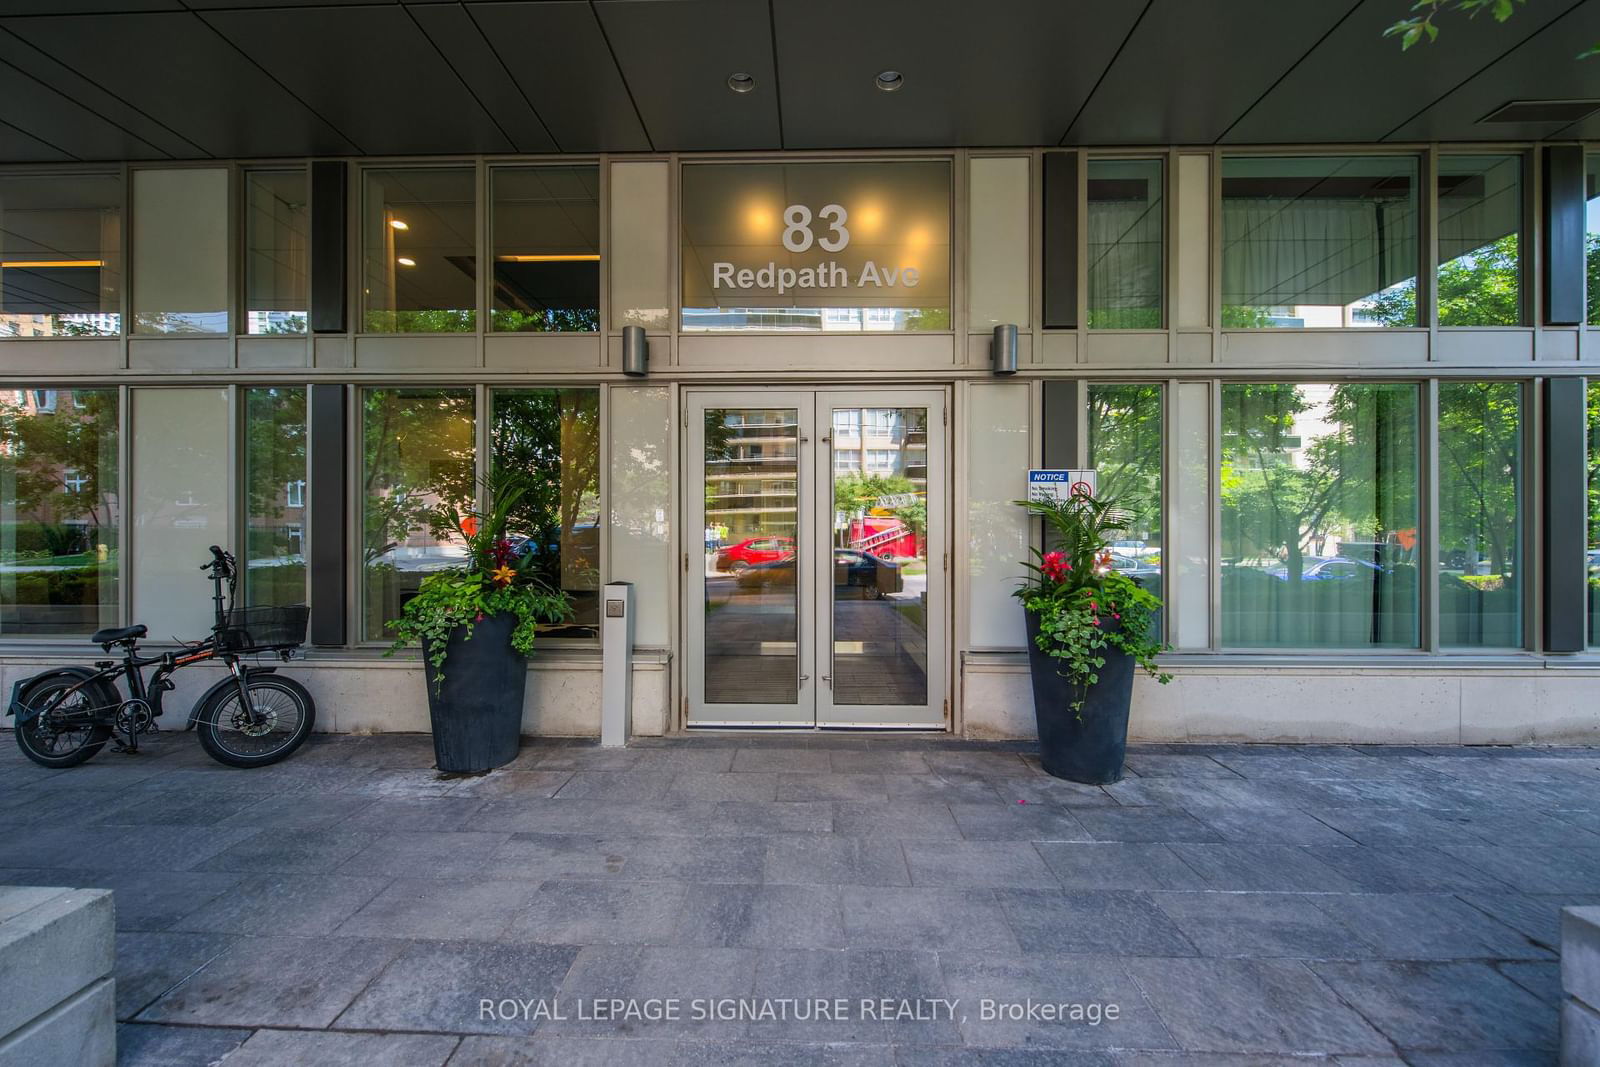
402 - 83 Redpath Ave
Listing History
Unit Highlights
Maintenance Fees
Utility Type
- Air Conditioning
- Central Air
- Heat Source
- Gas
- Heating
- Forced Air
Room Dimensions
About this Listing
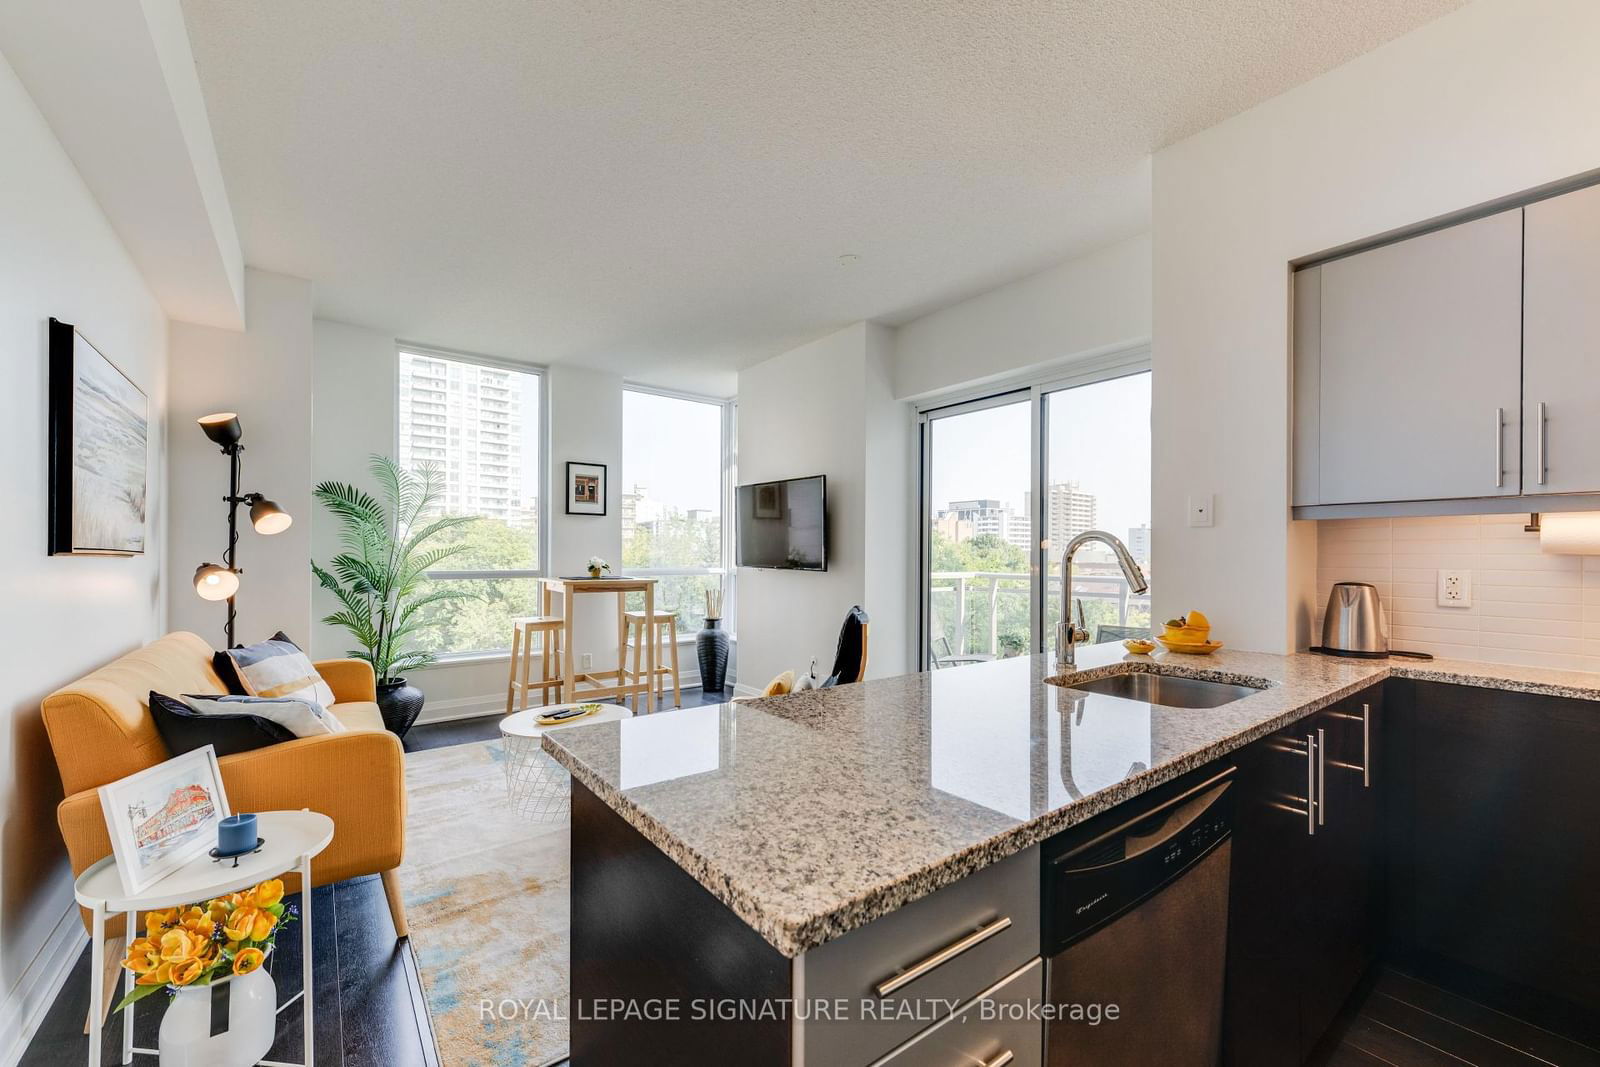
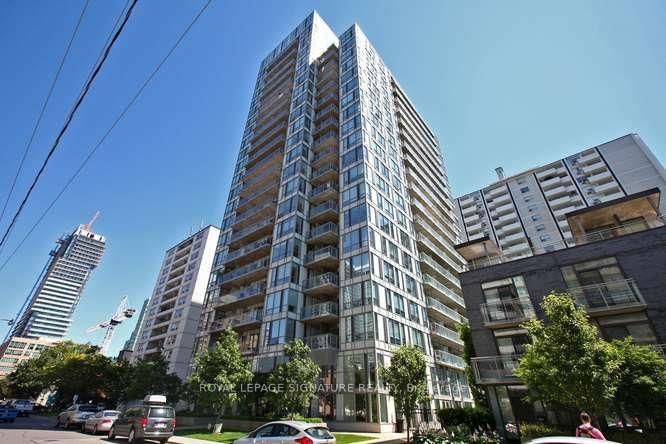
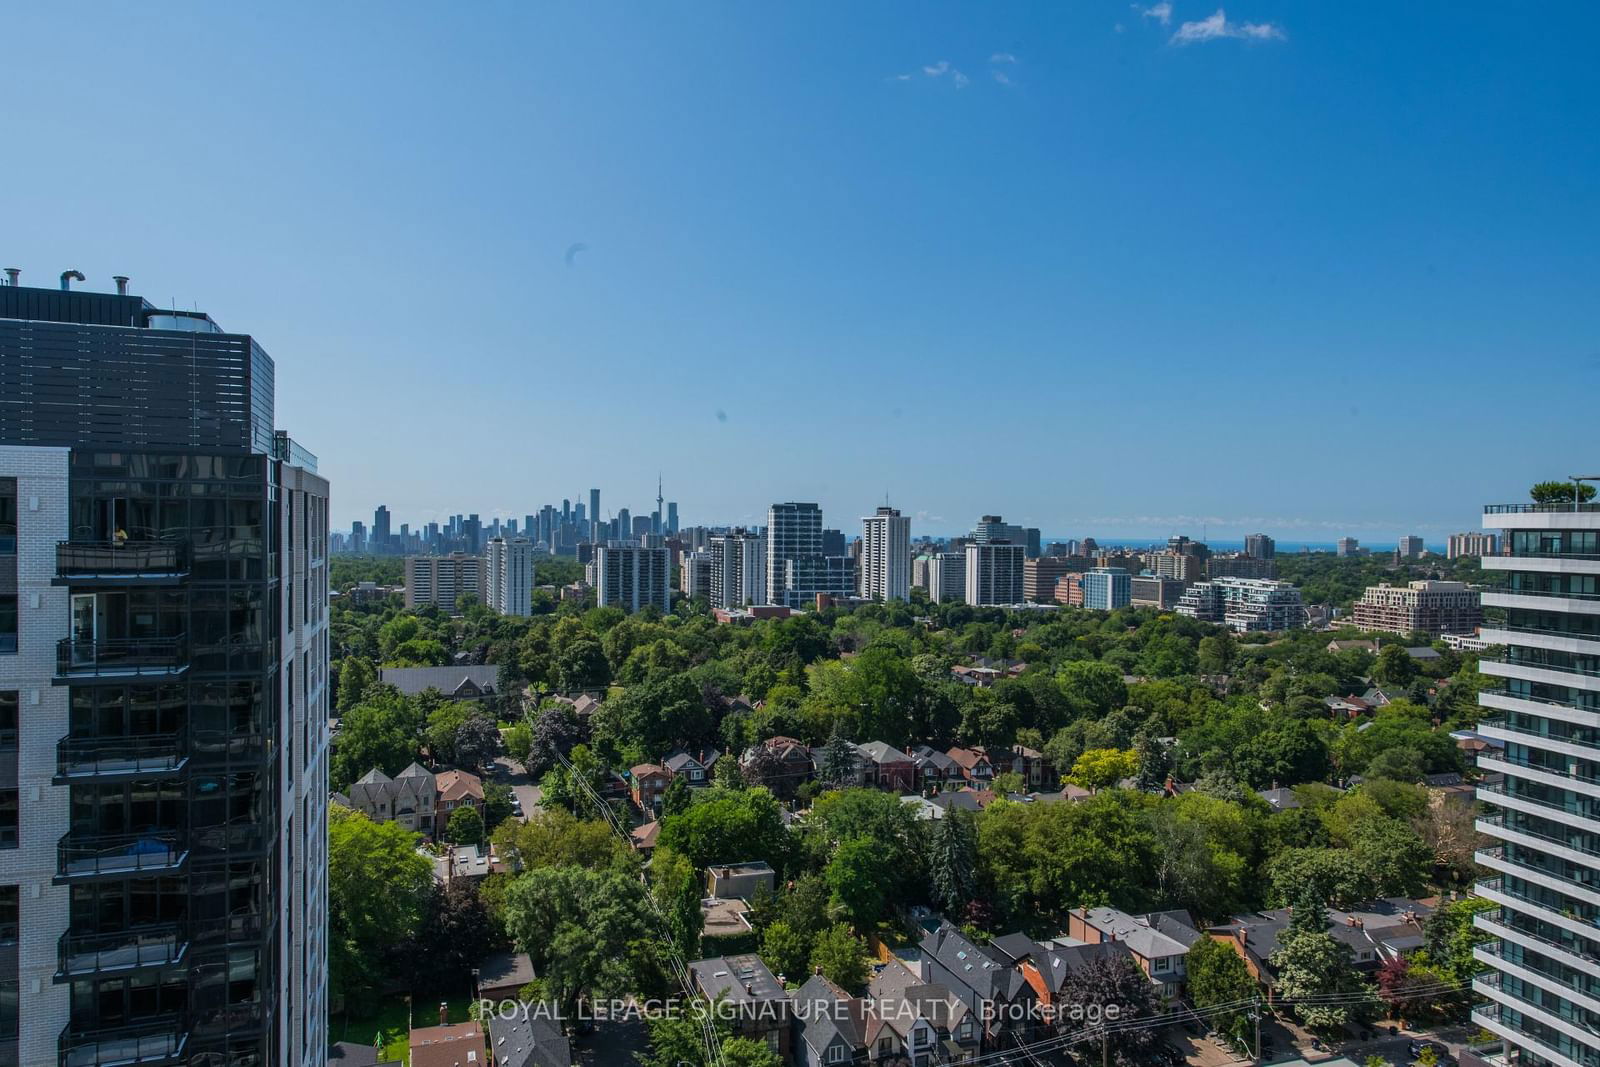
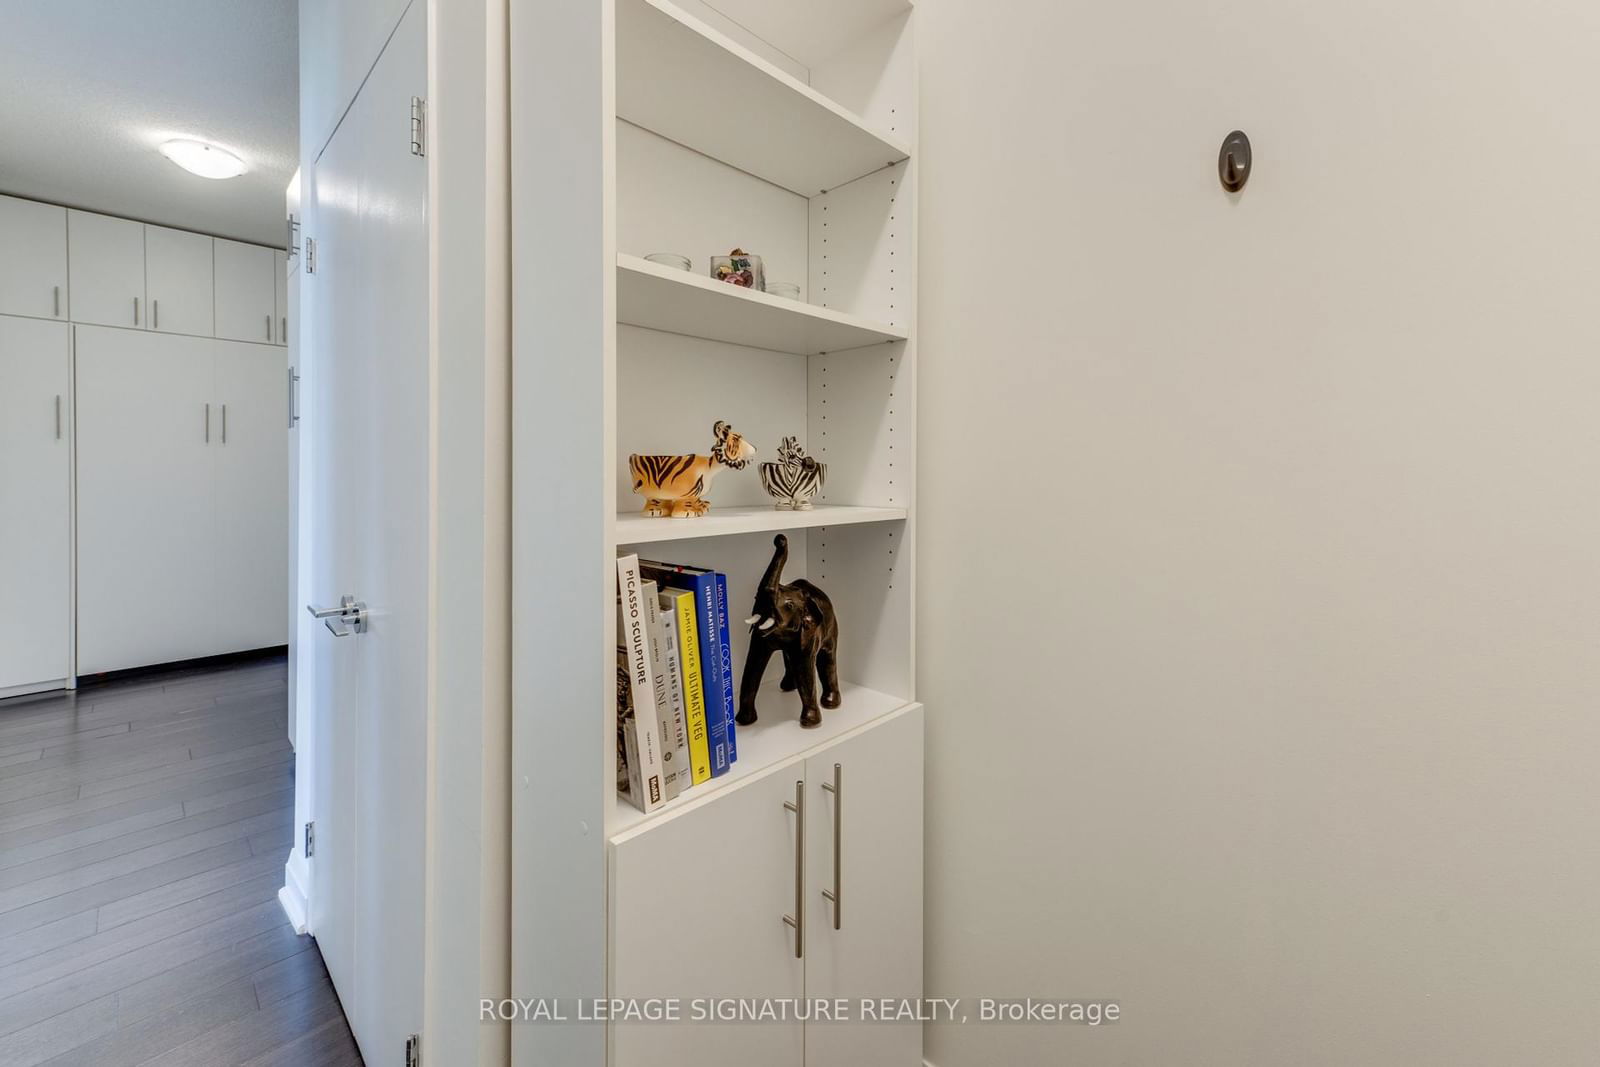
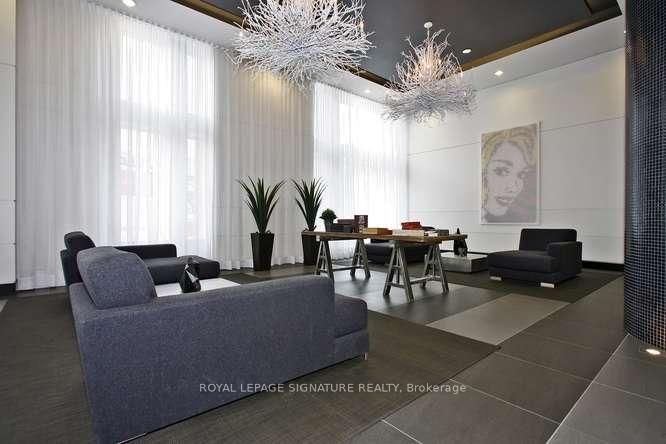
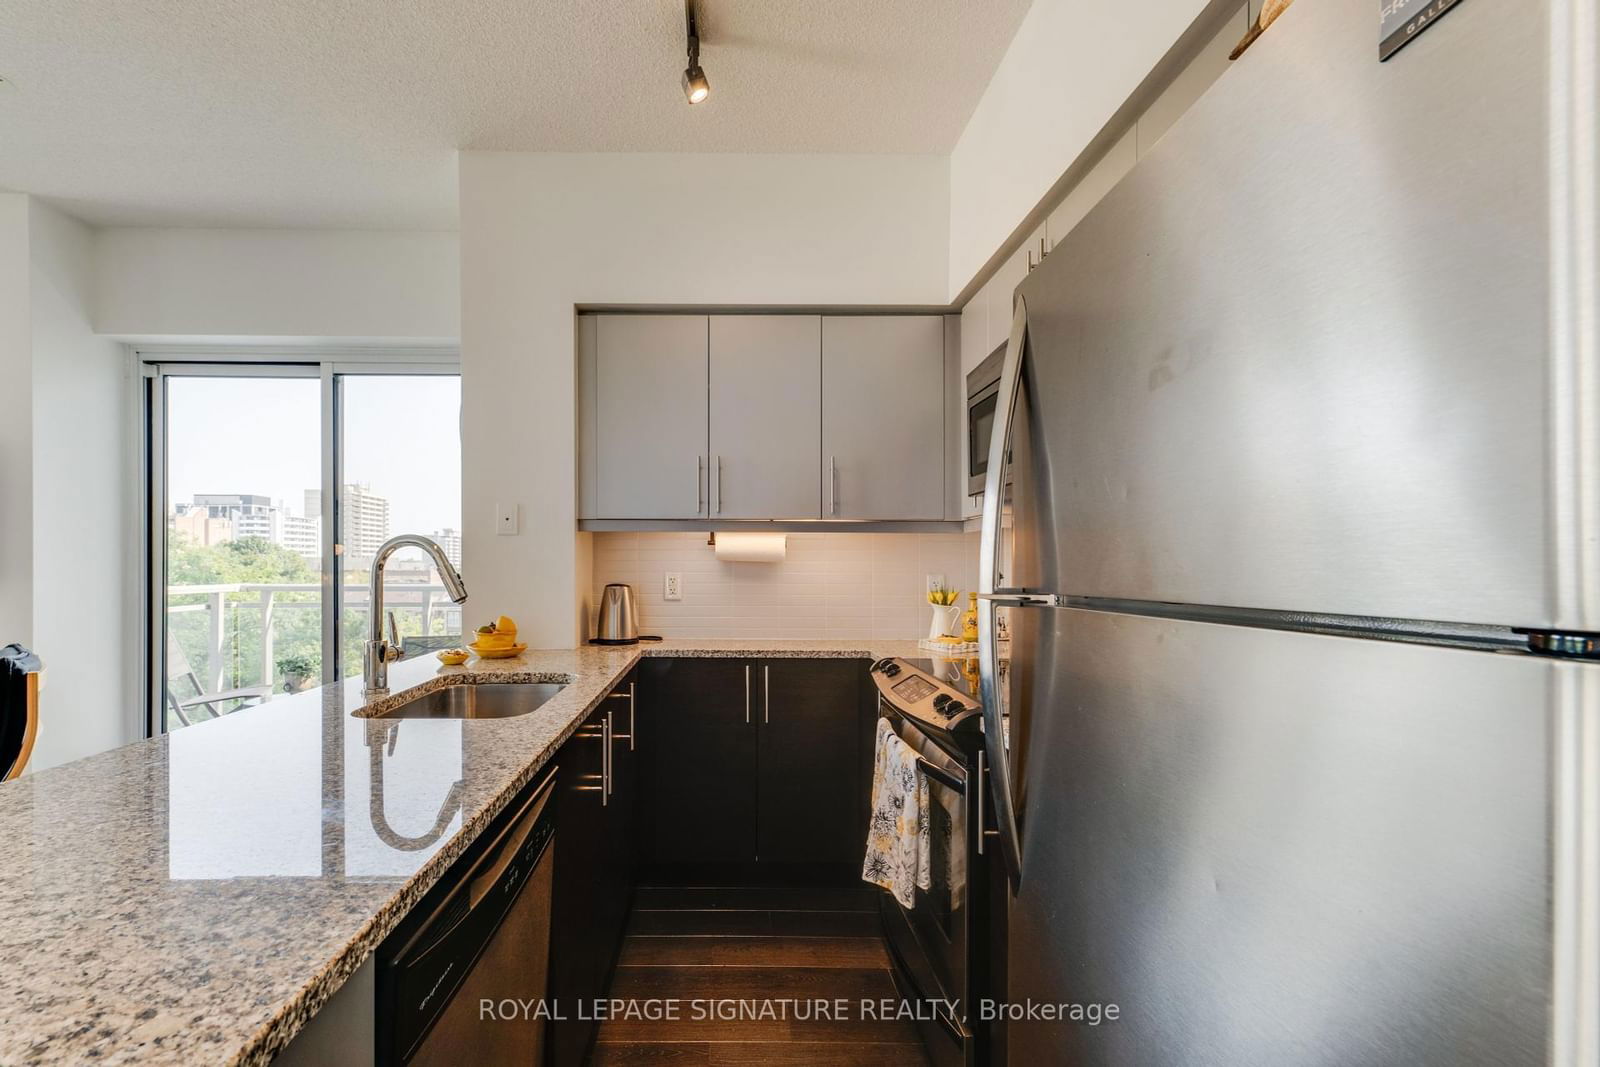
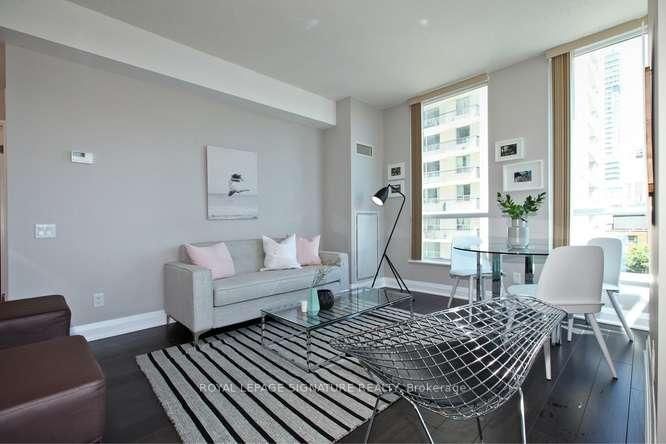
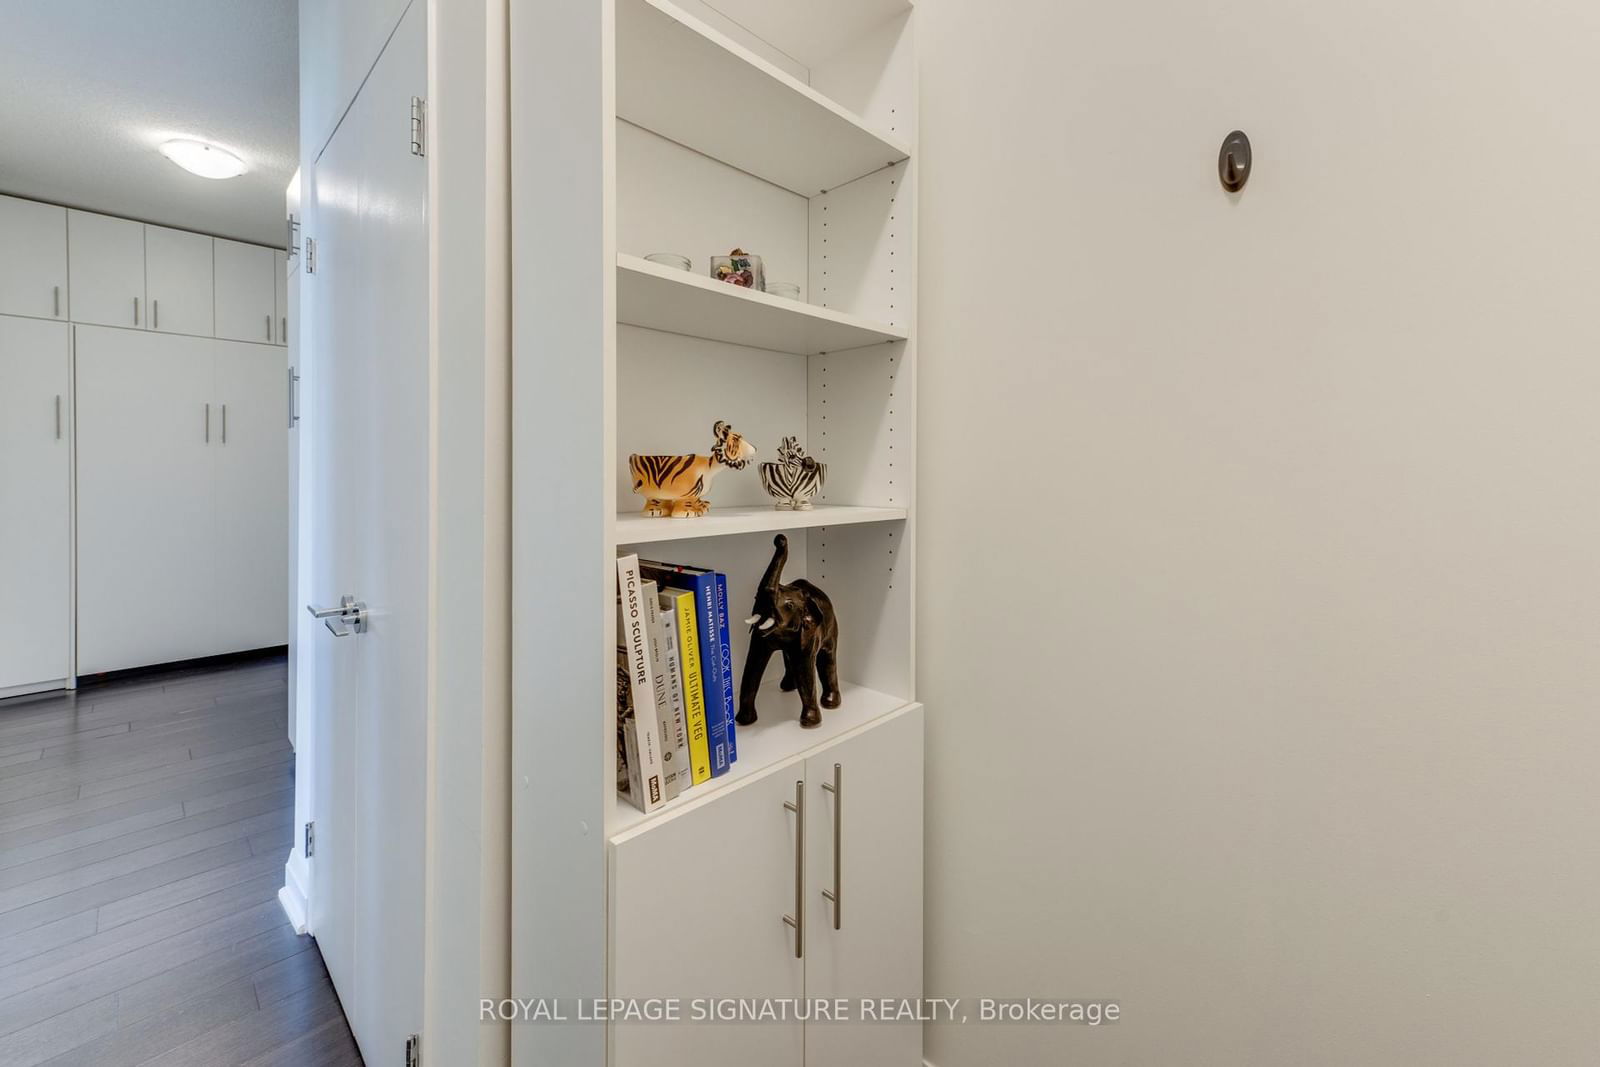
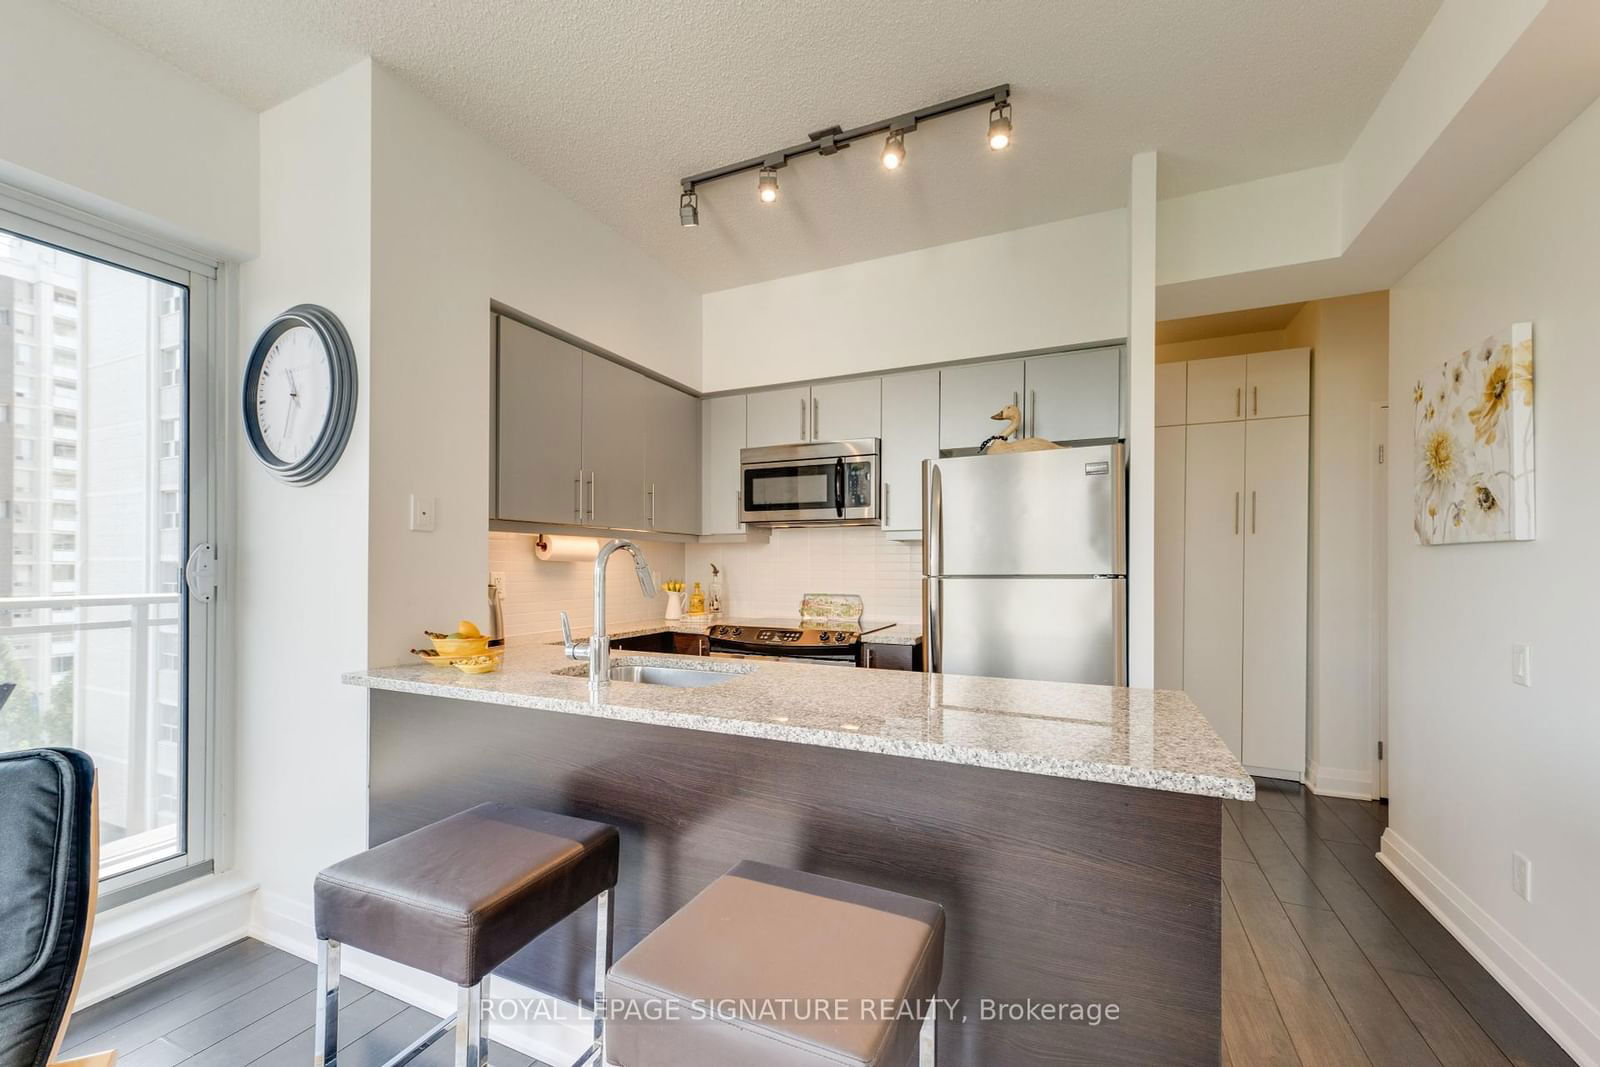
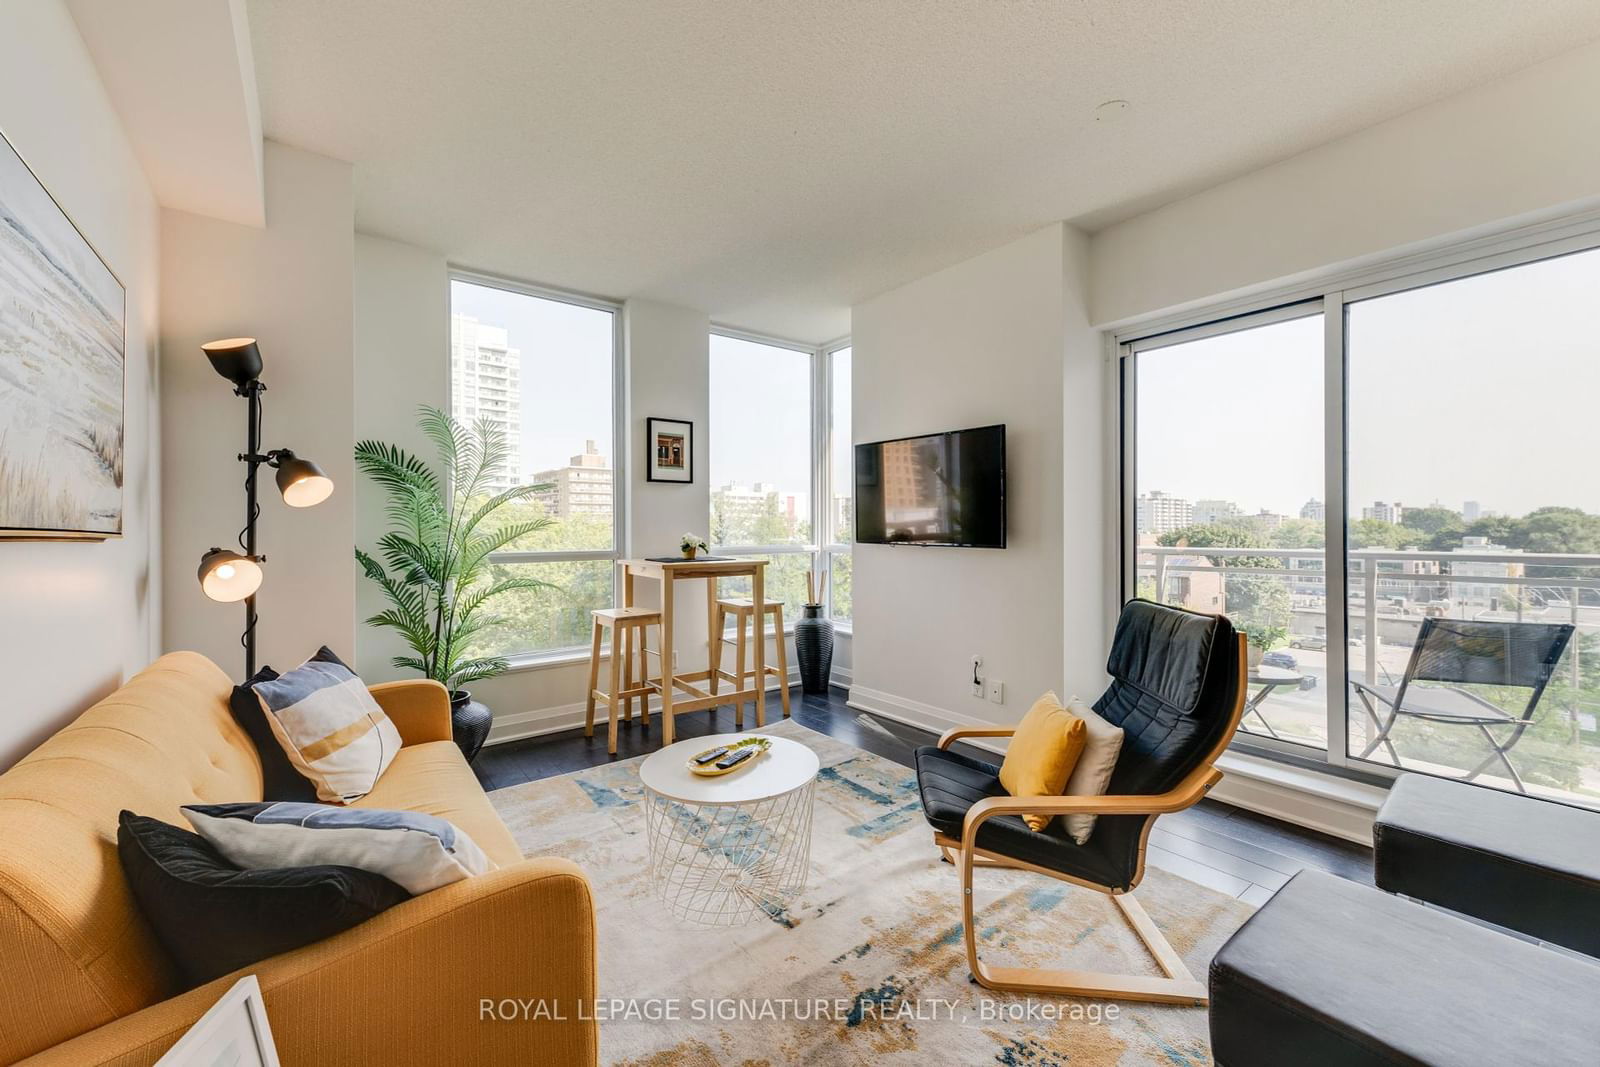
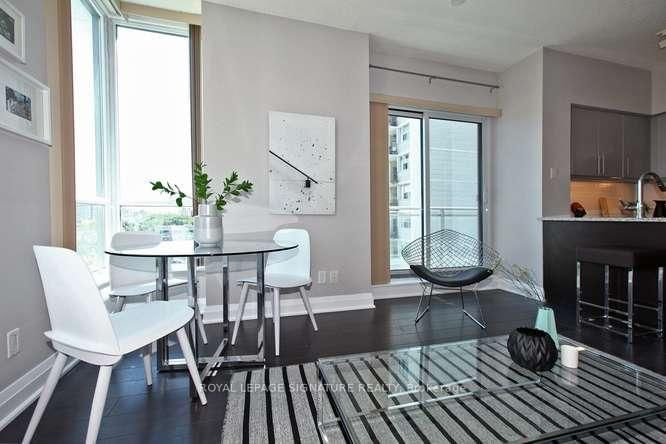
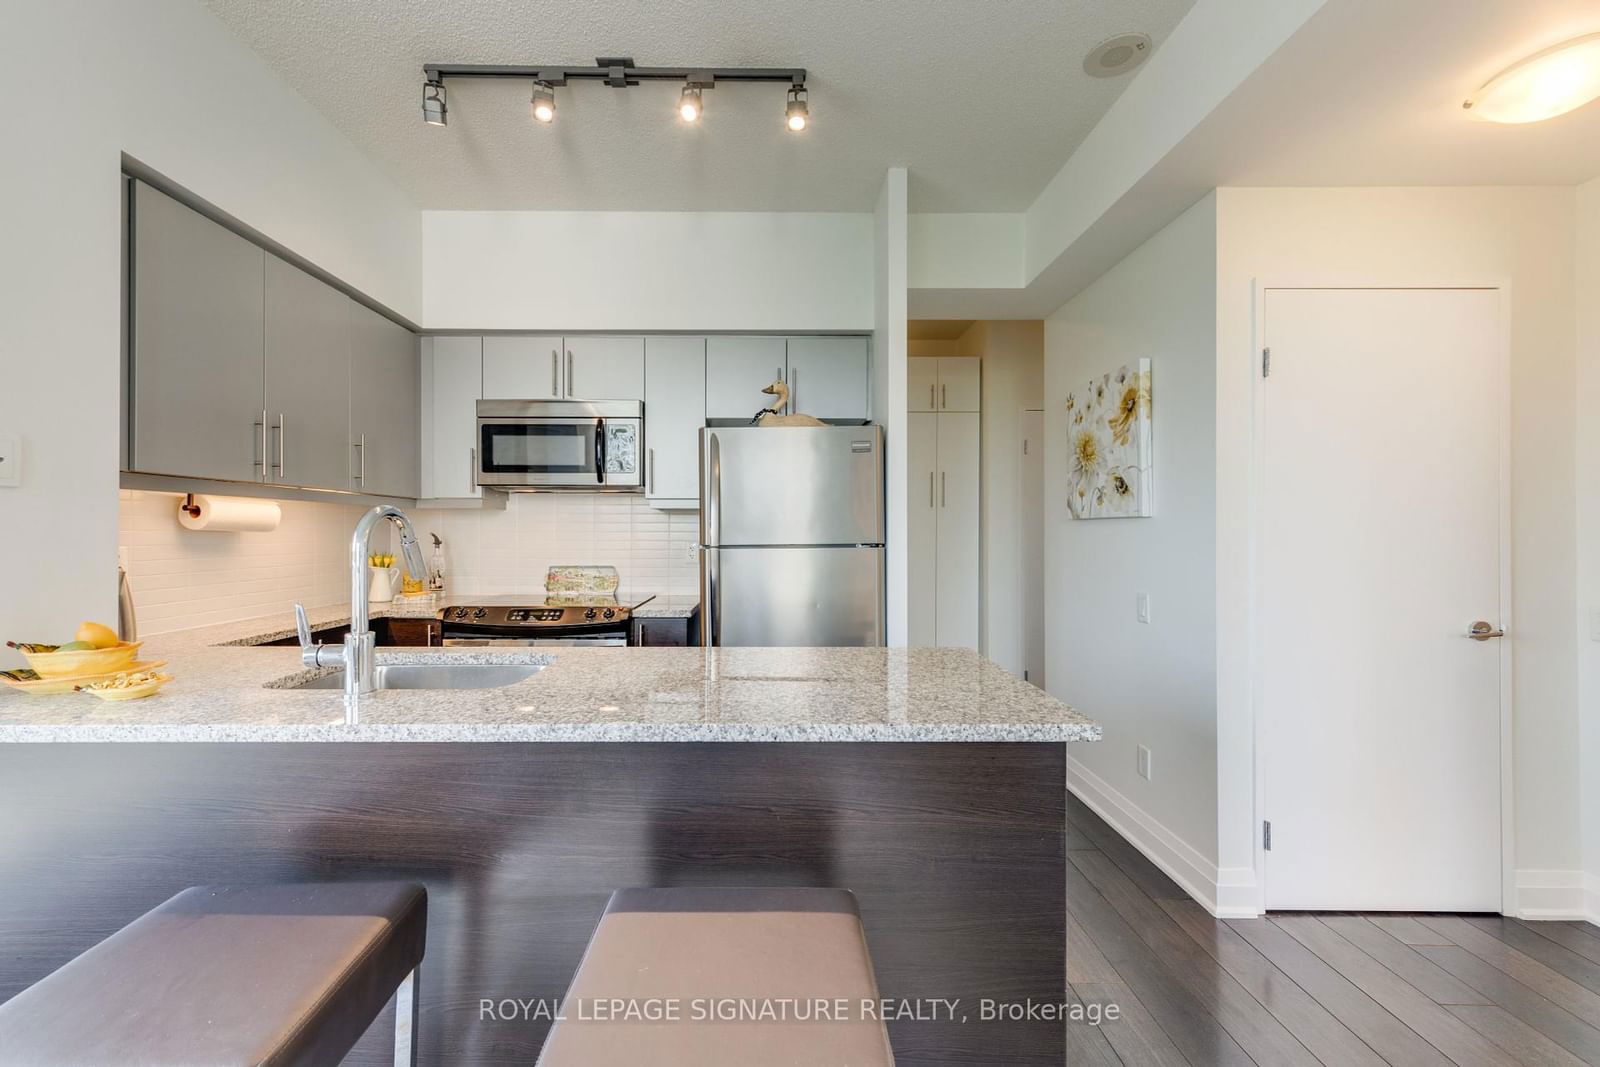
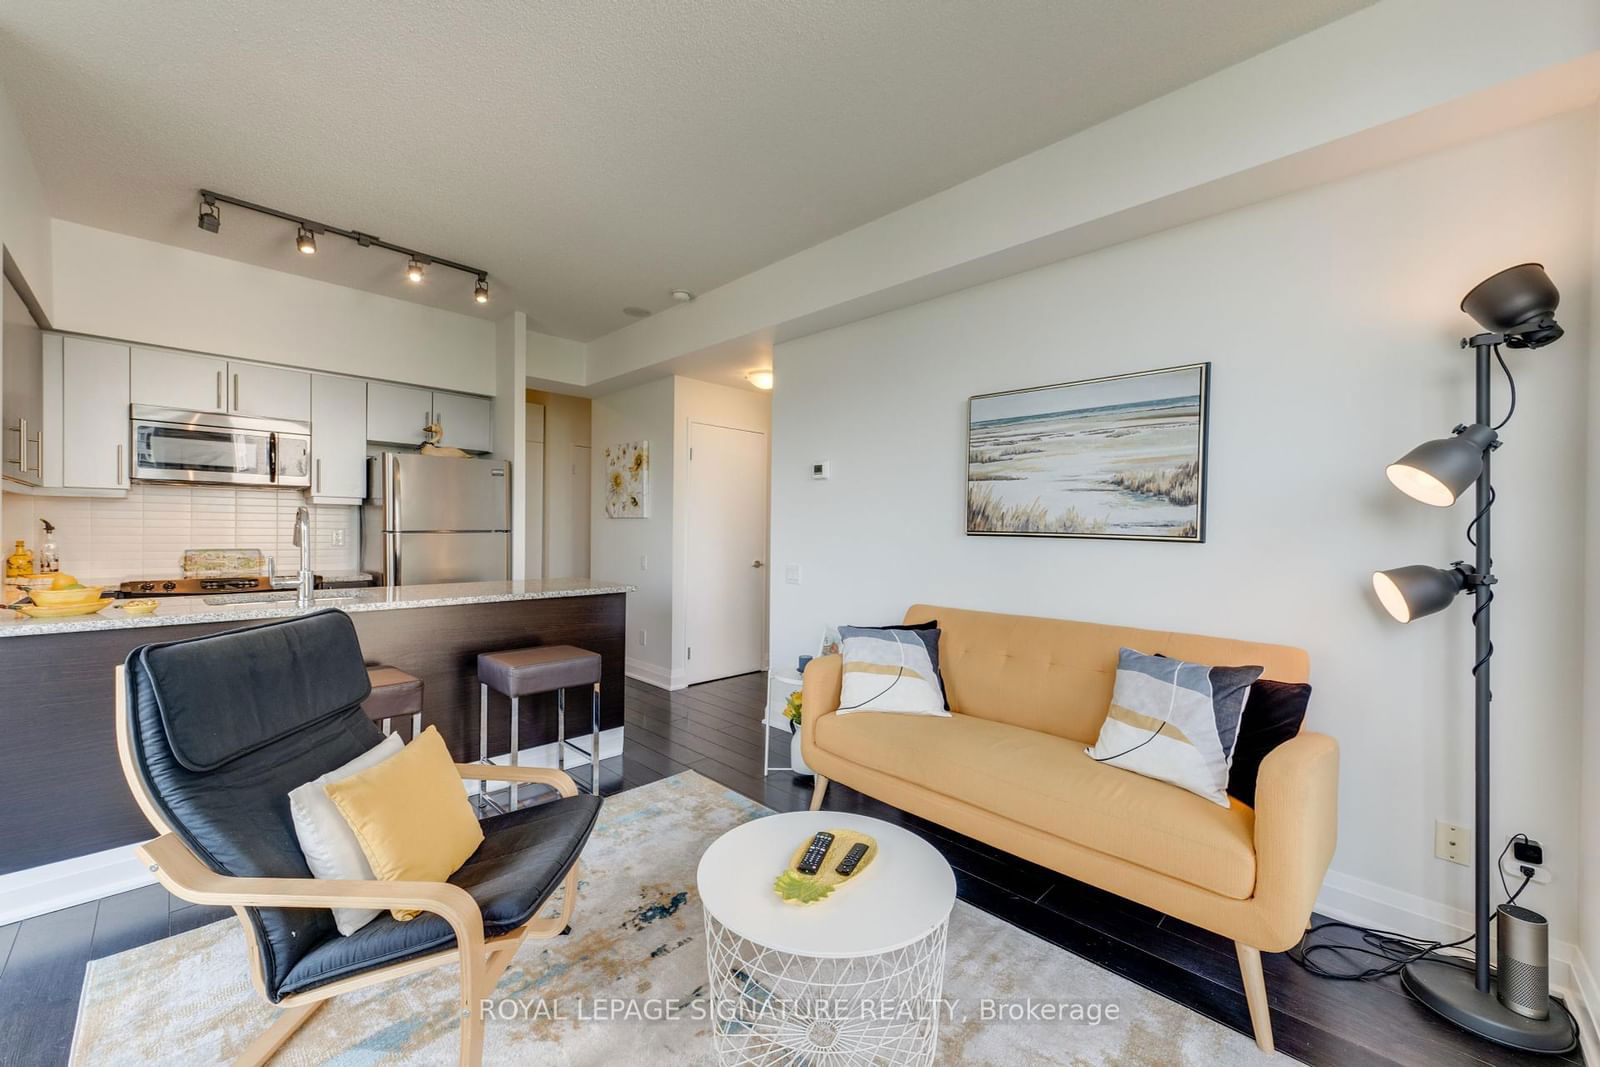
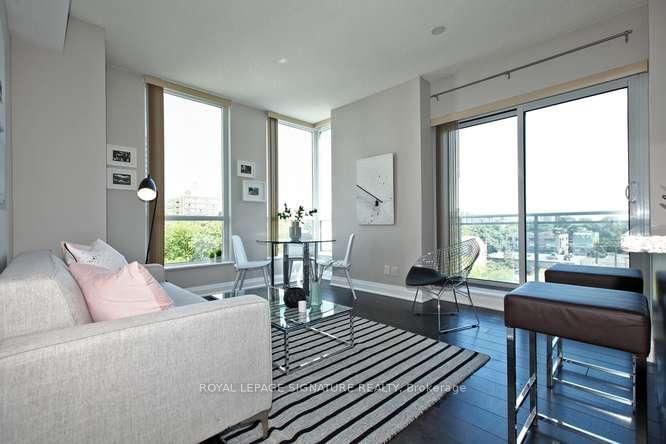
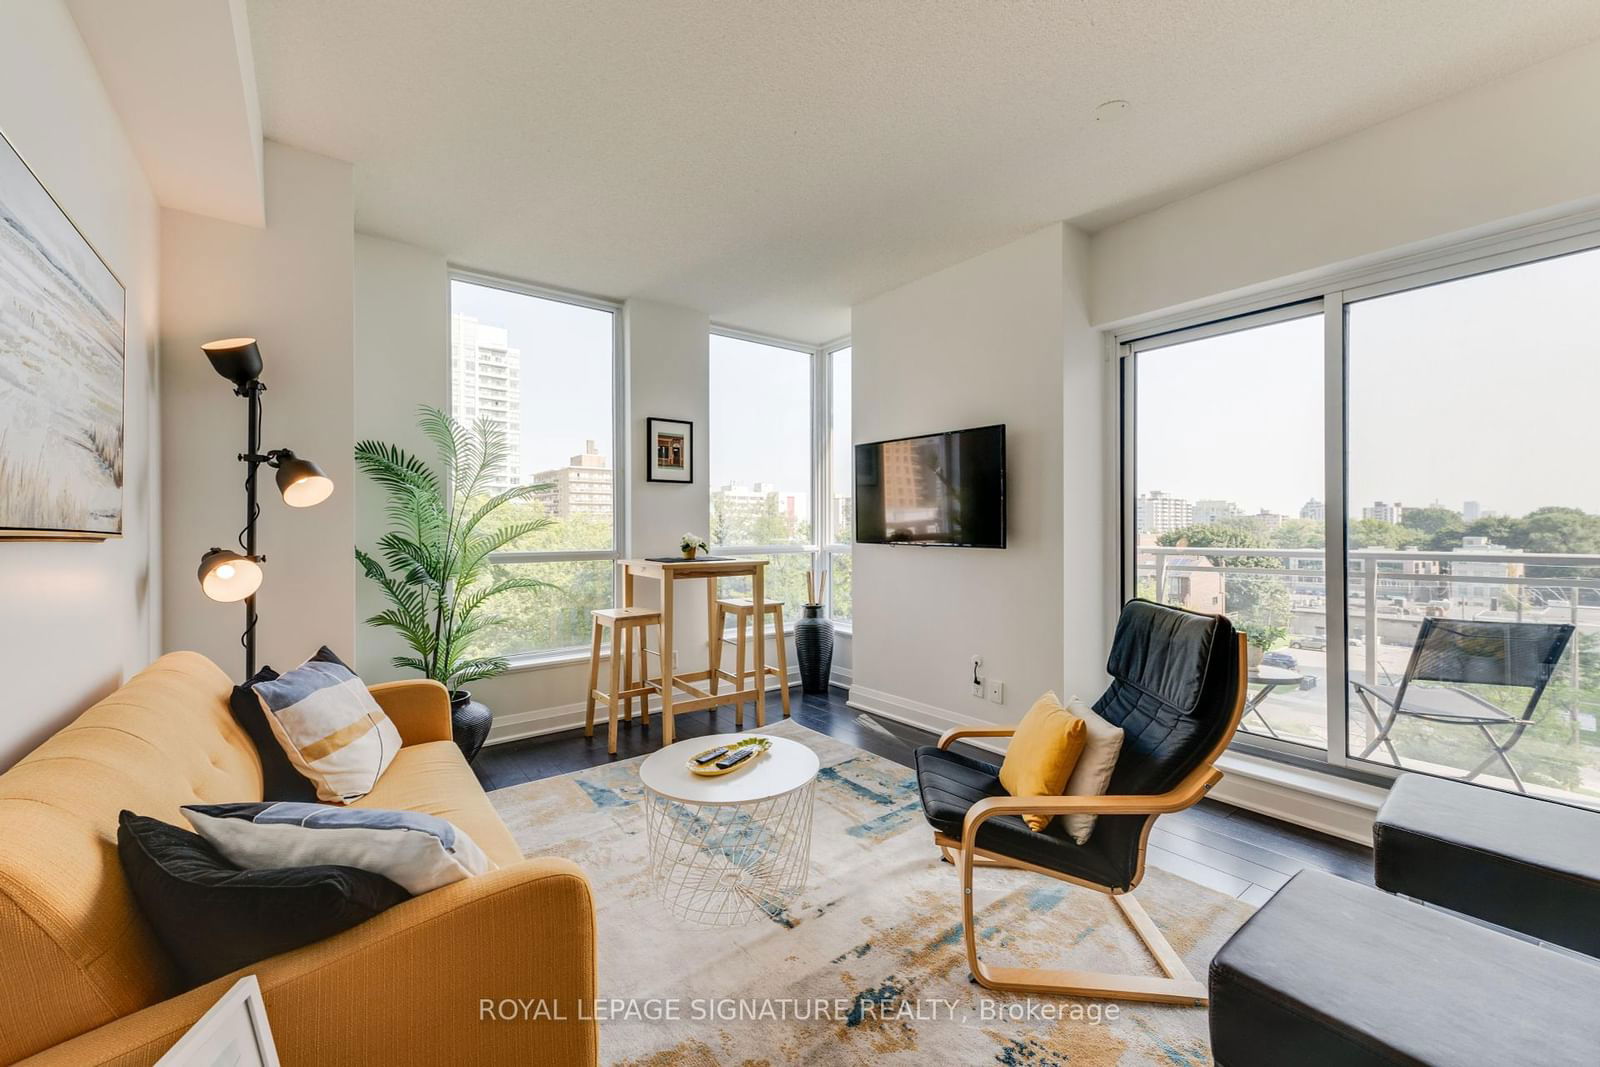
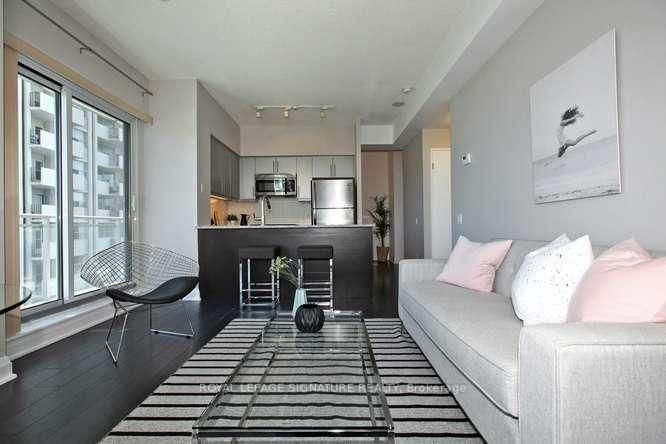
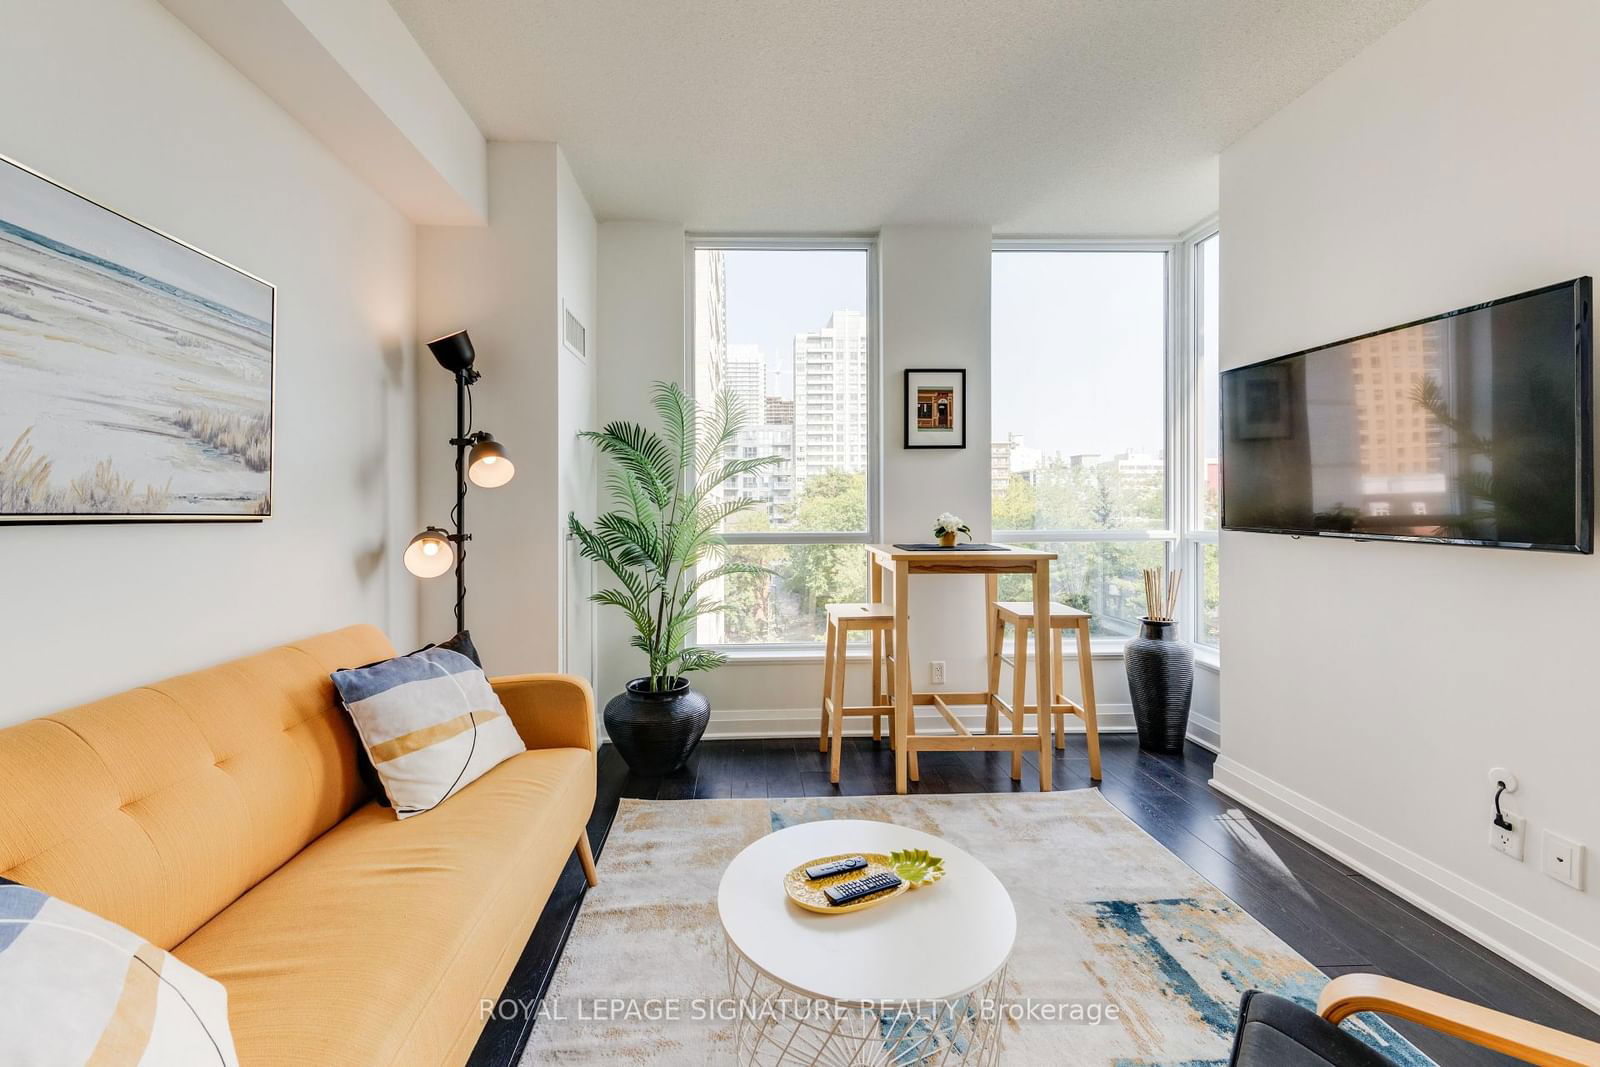
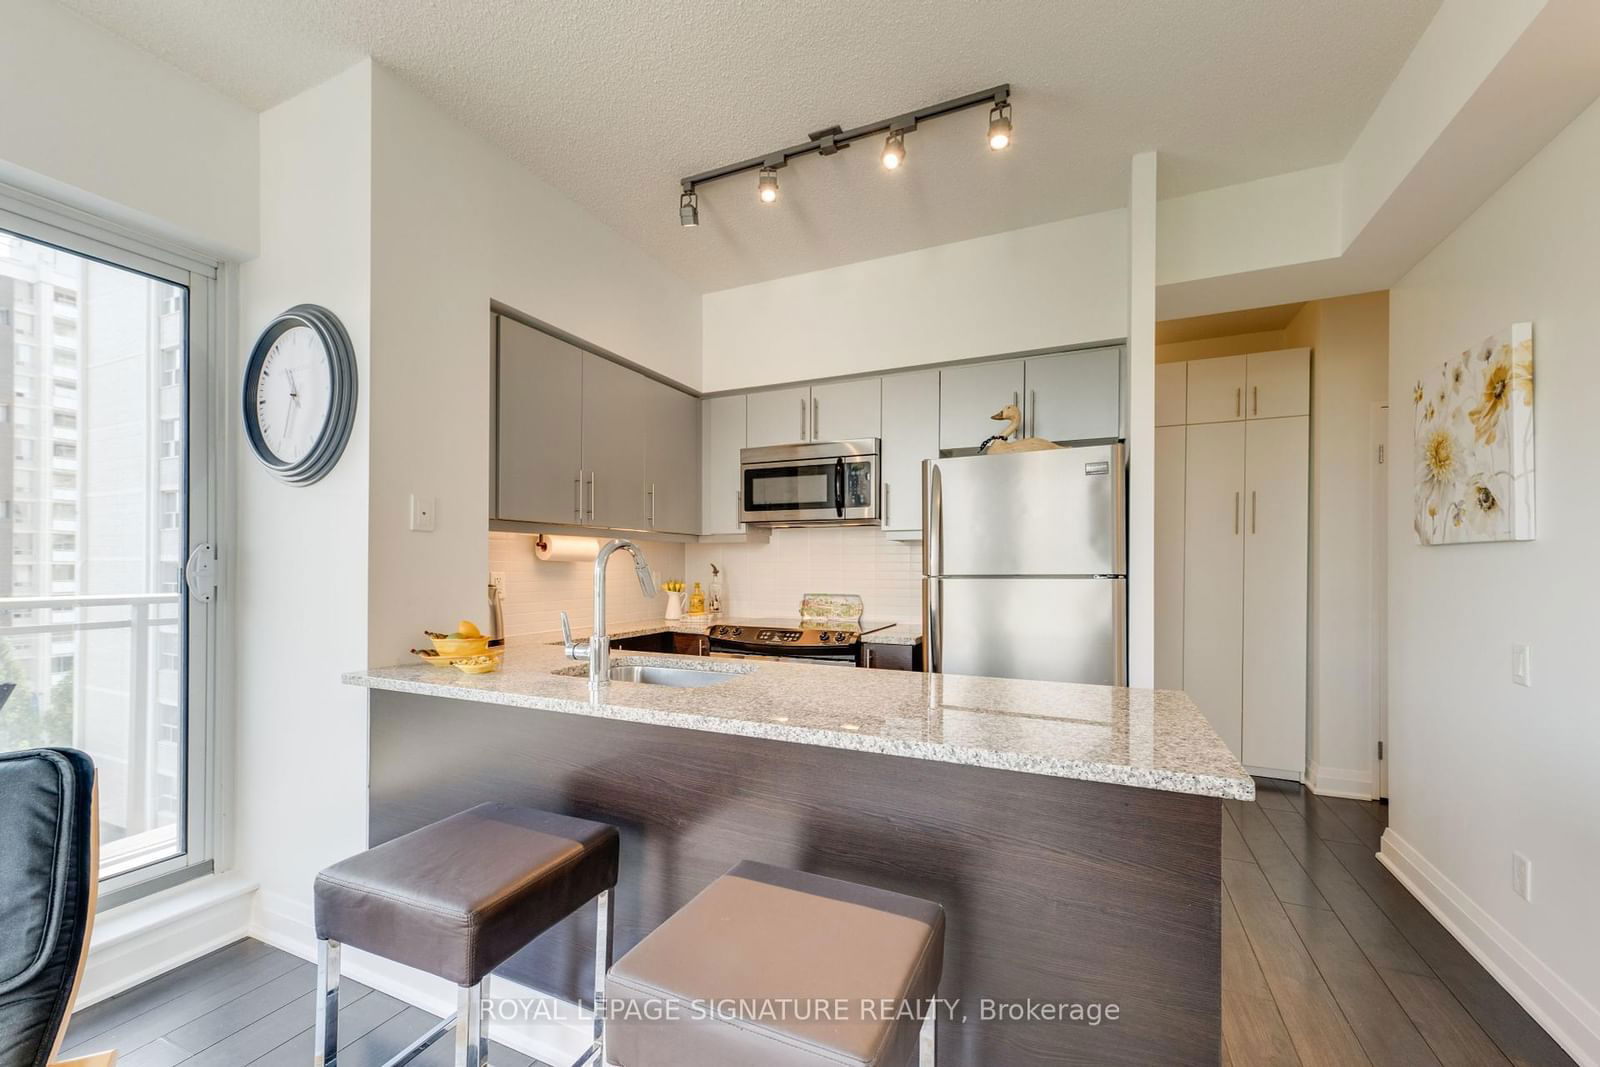
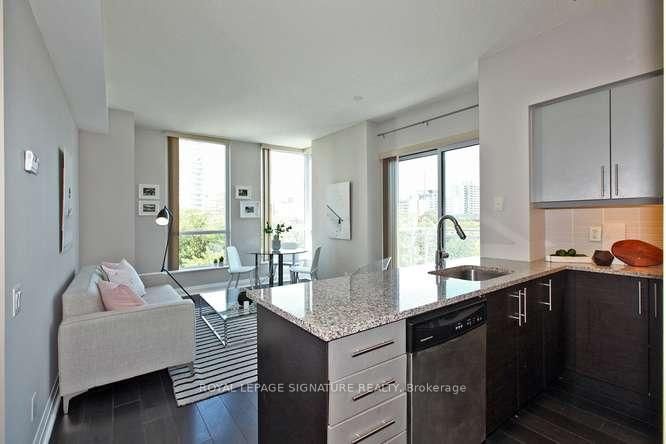
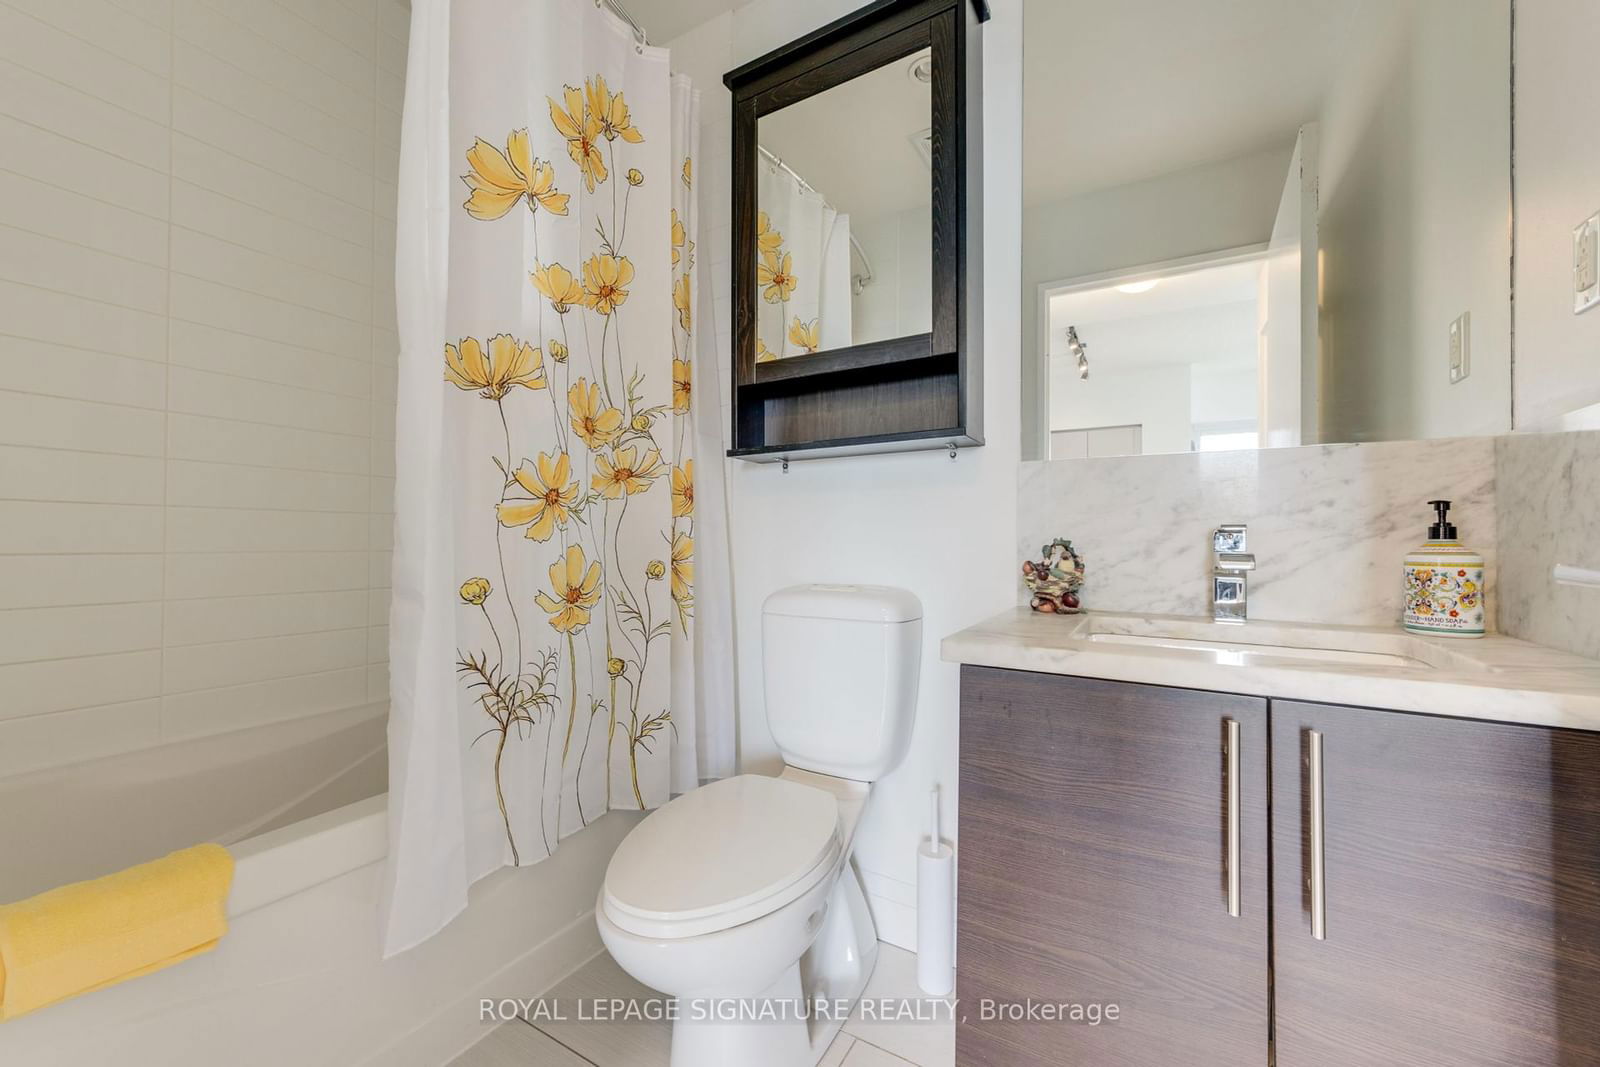
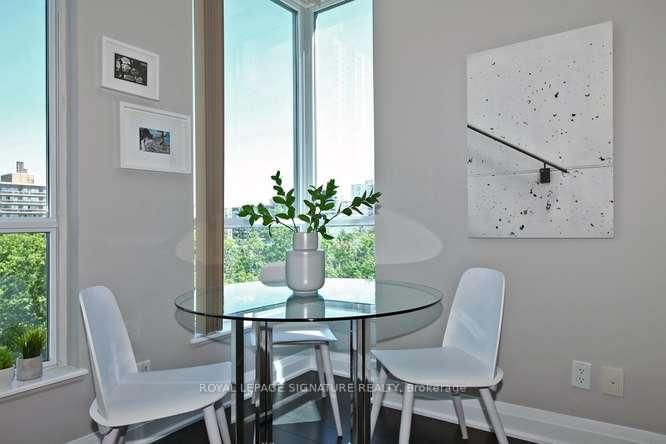
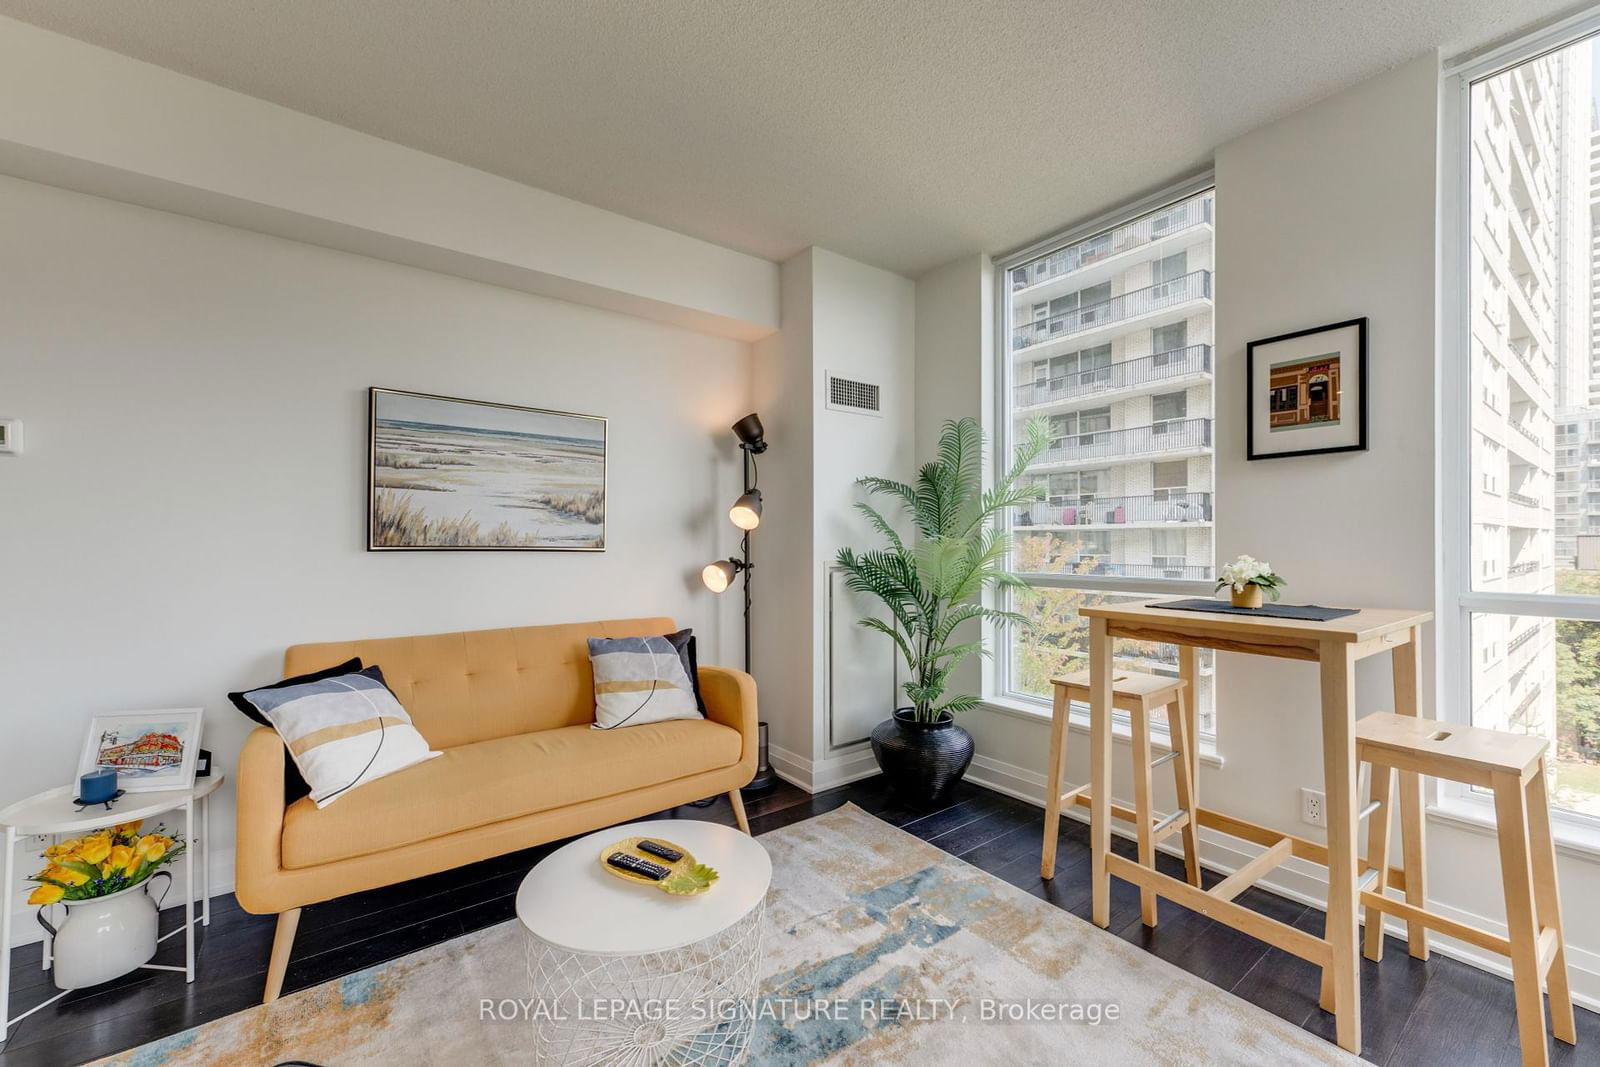
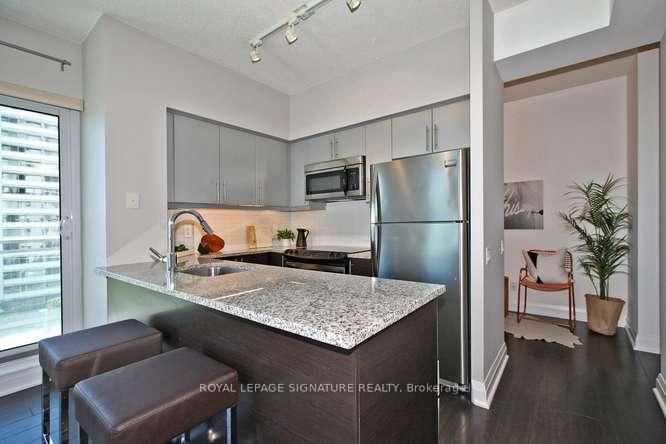
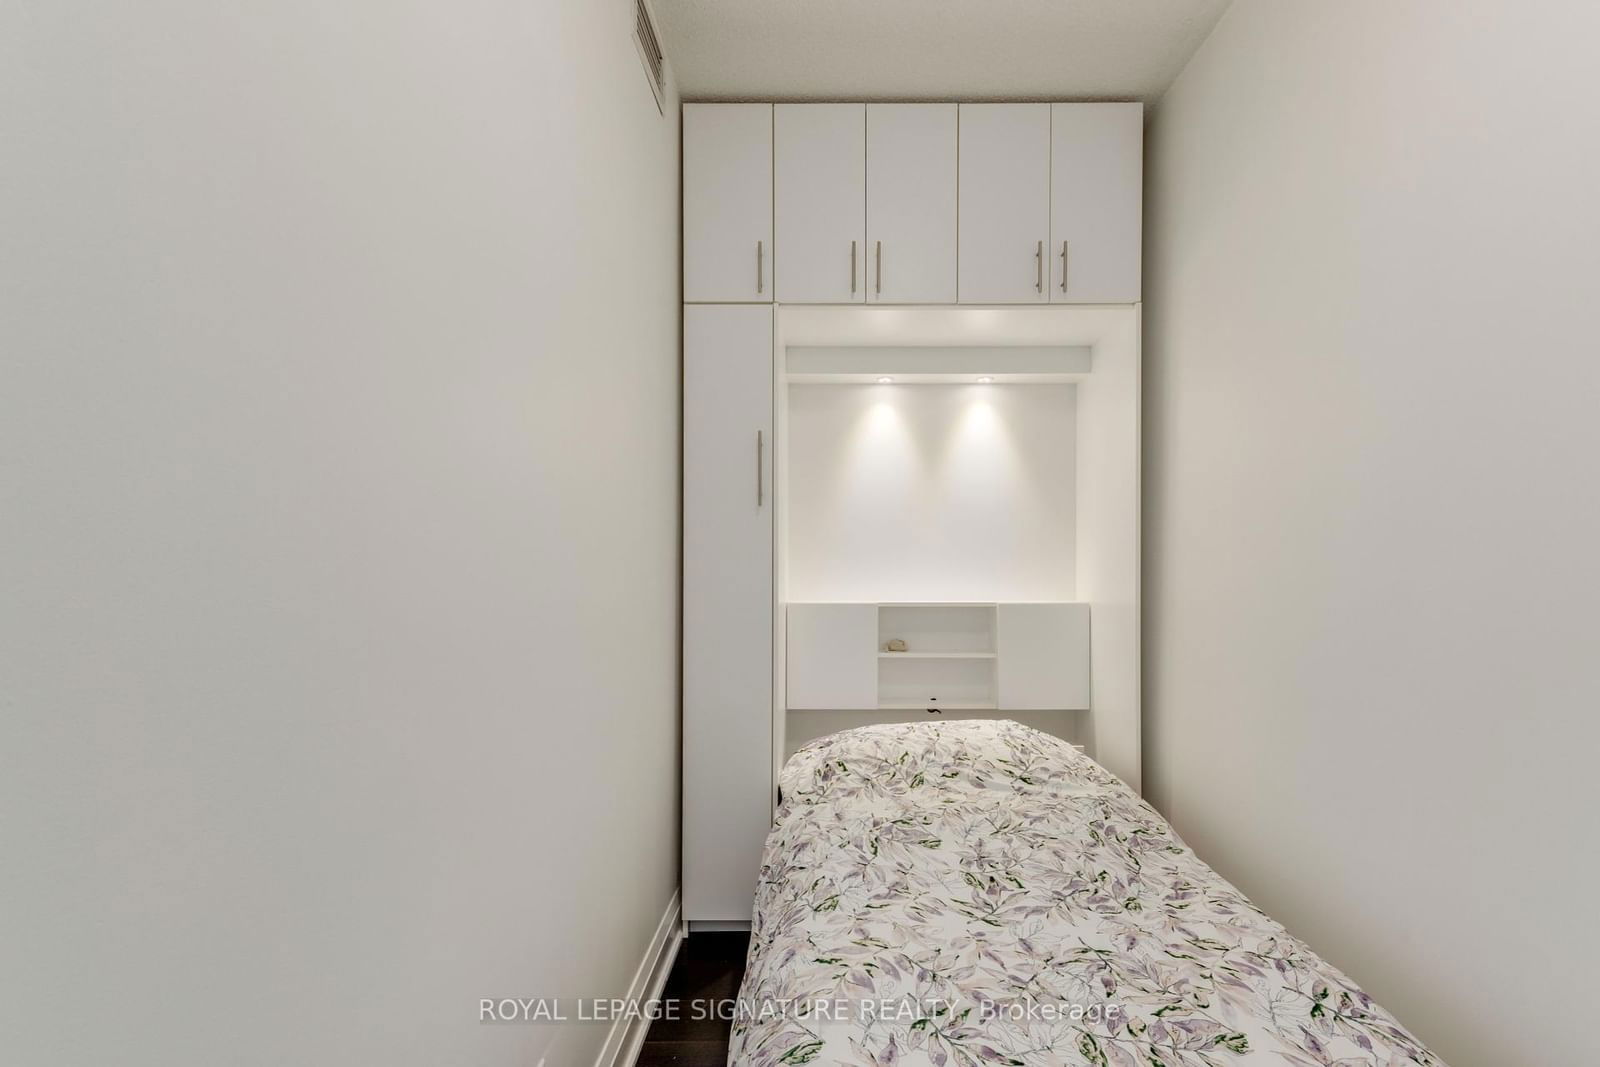
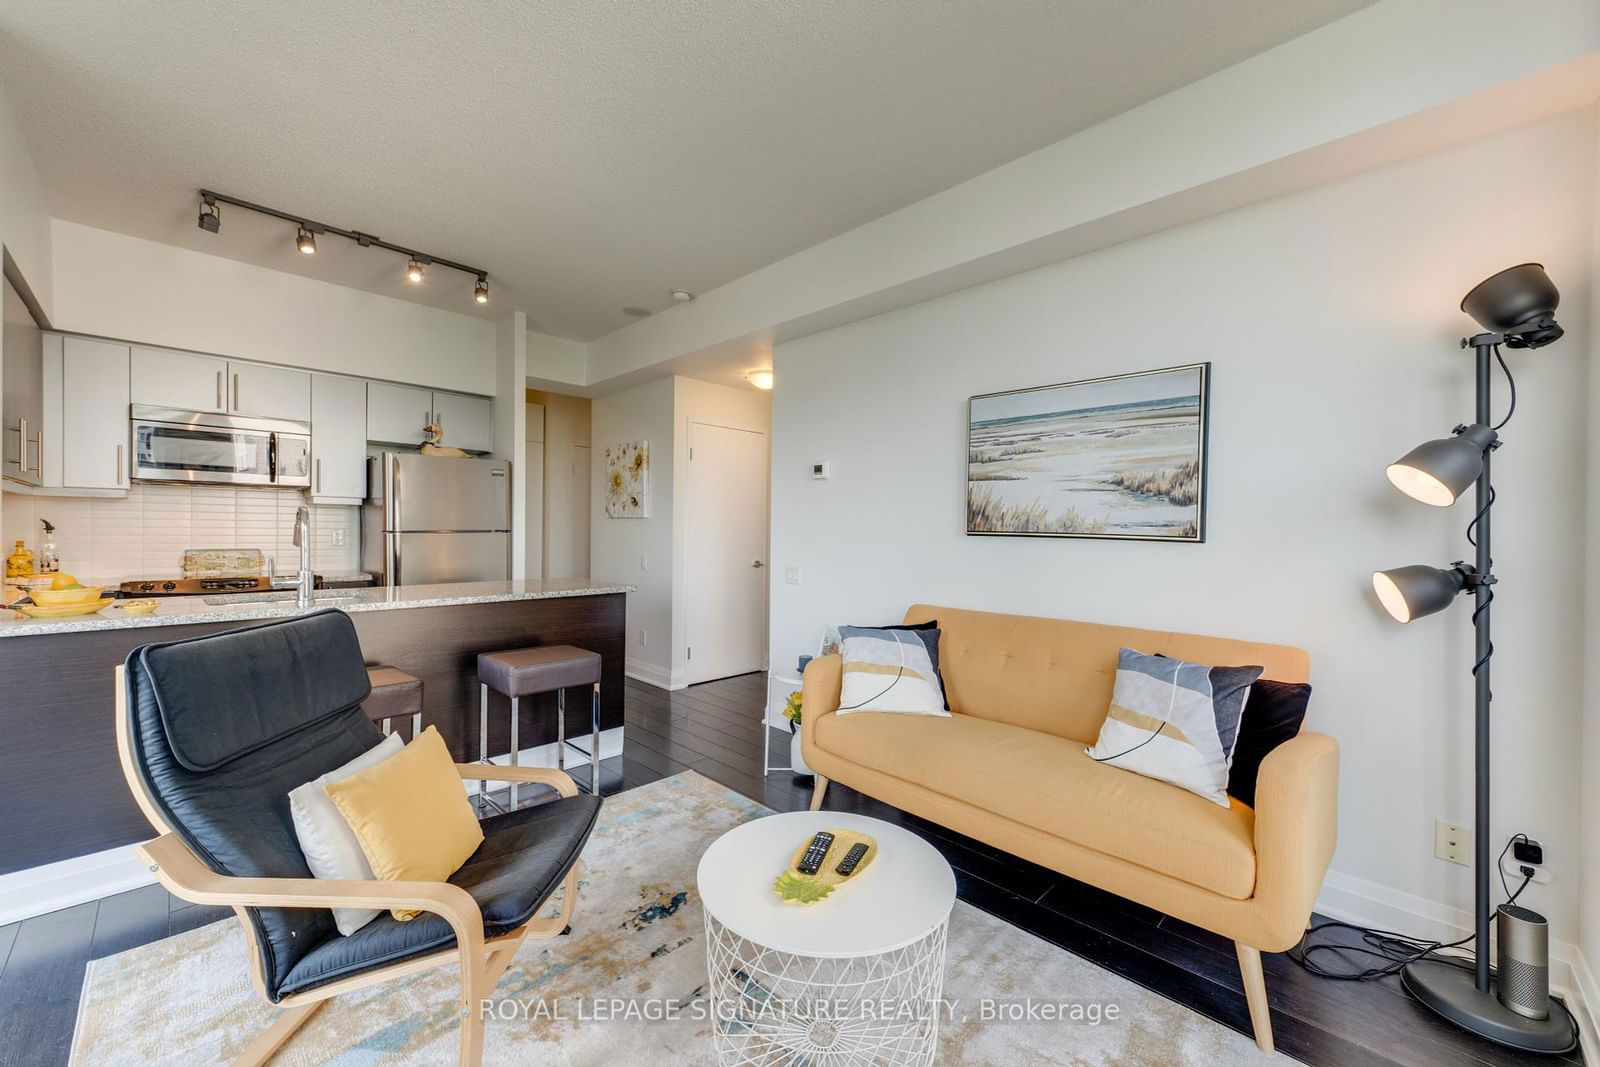
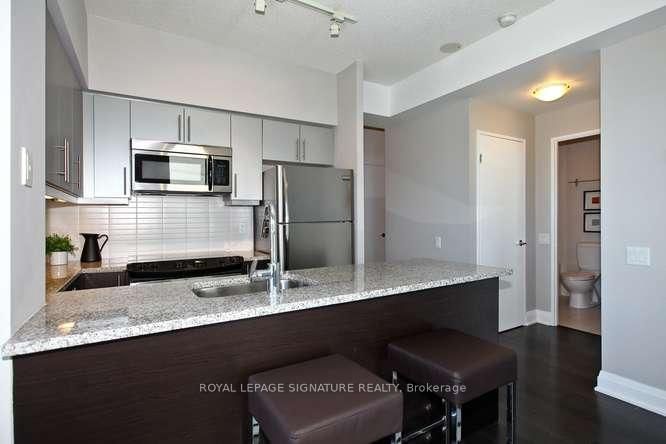
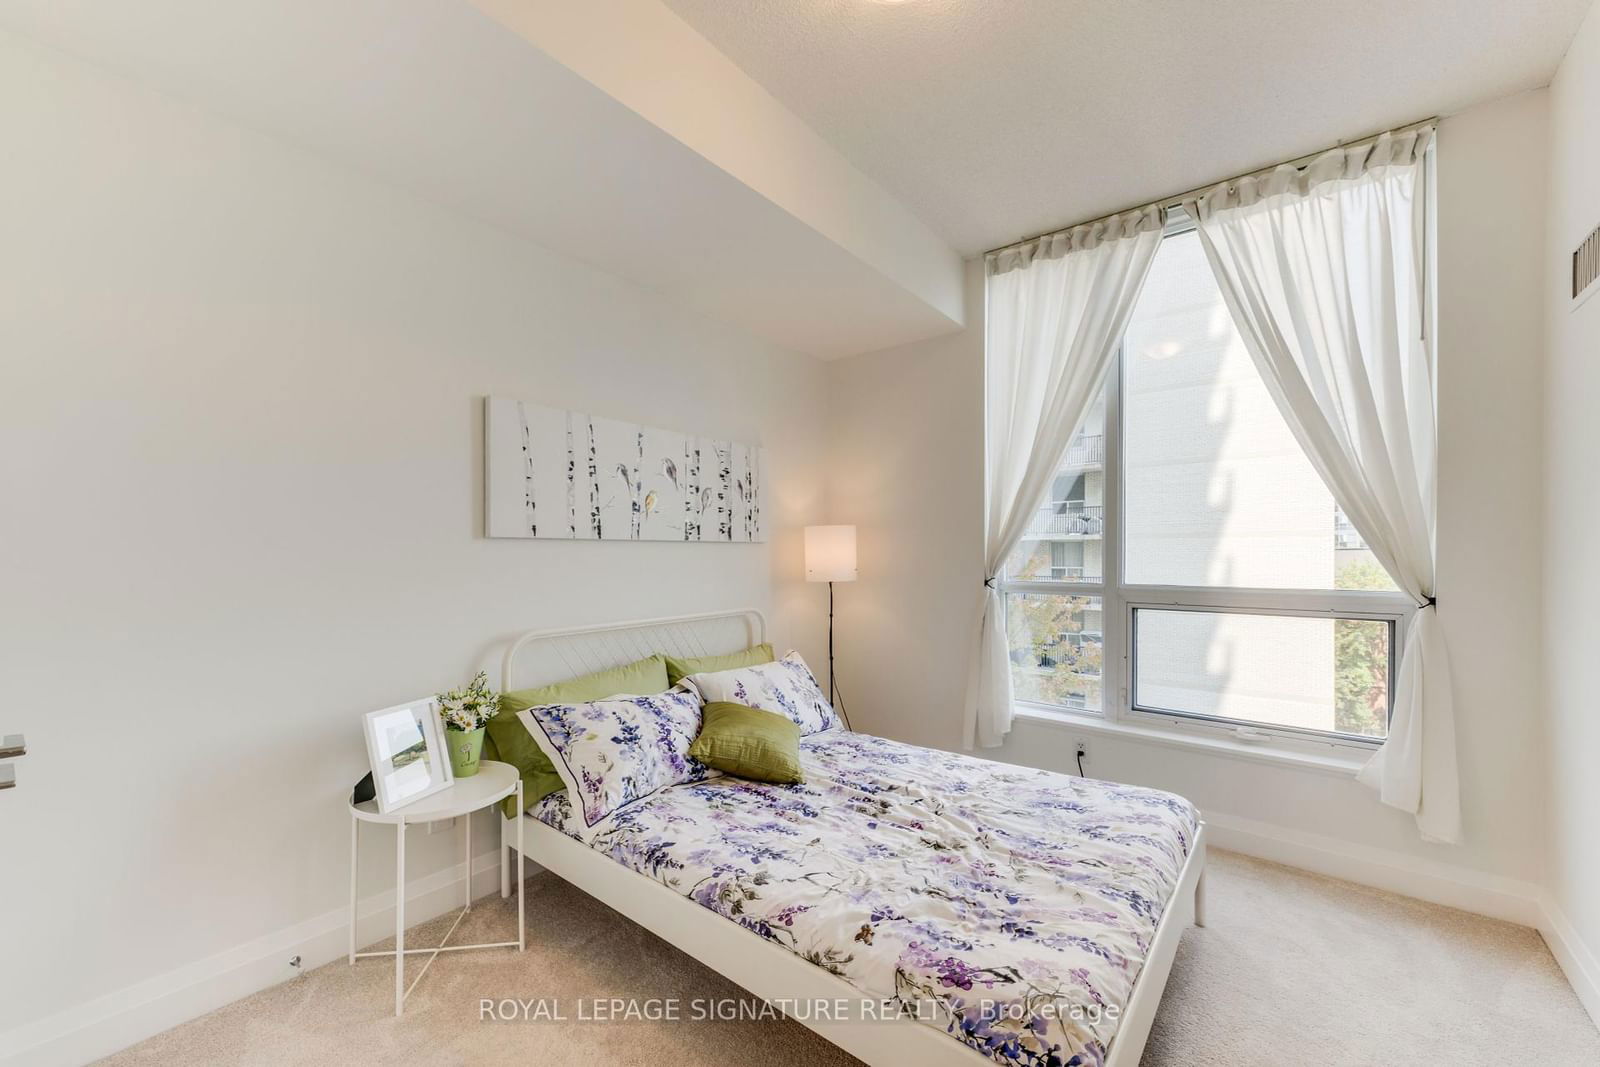
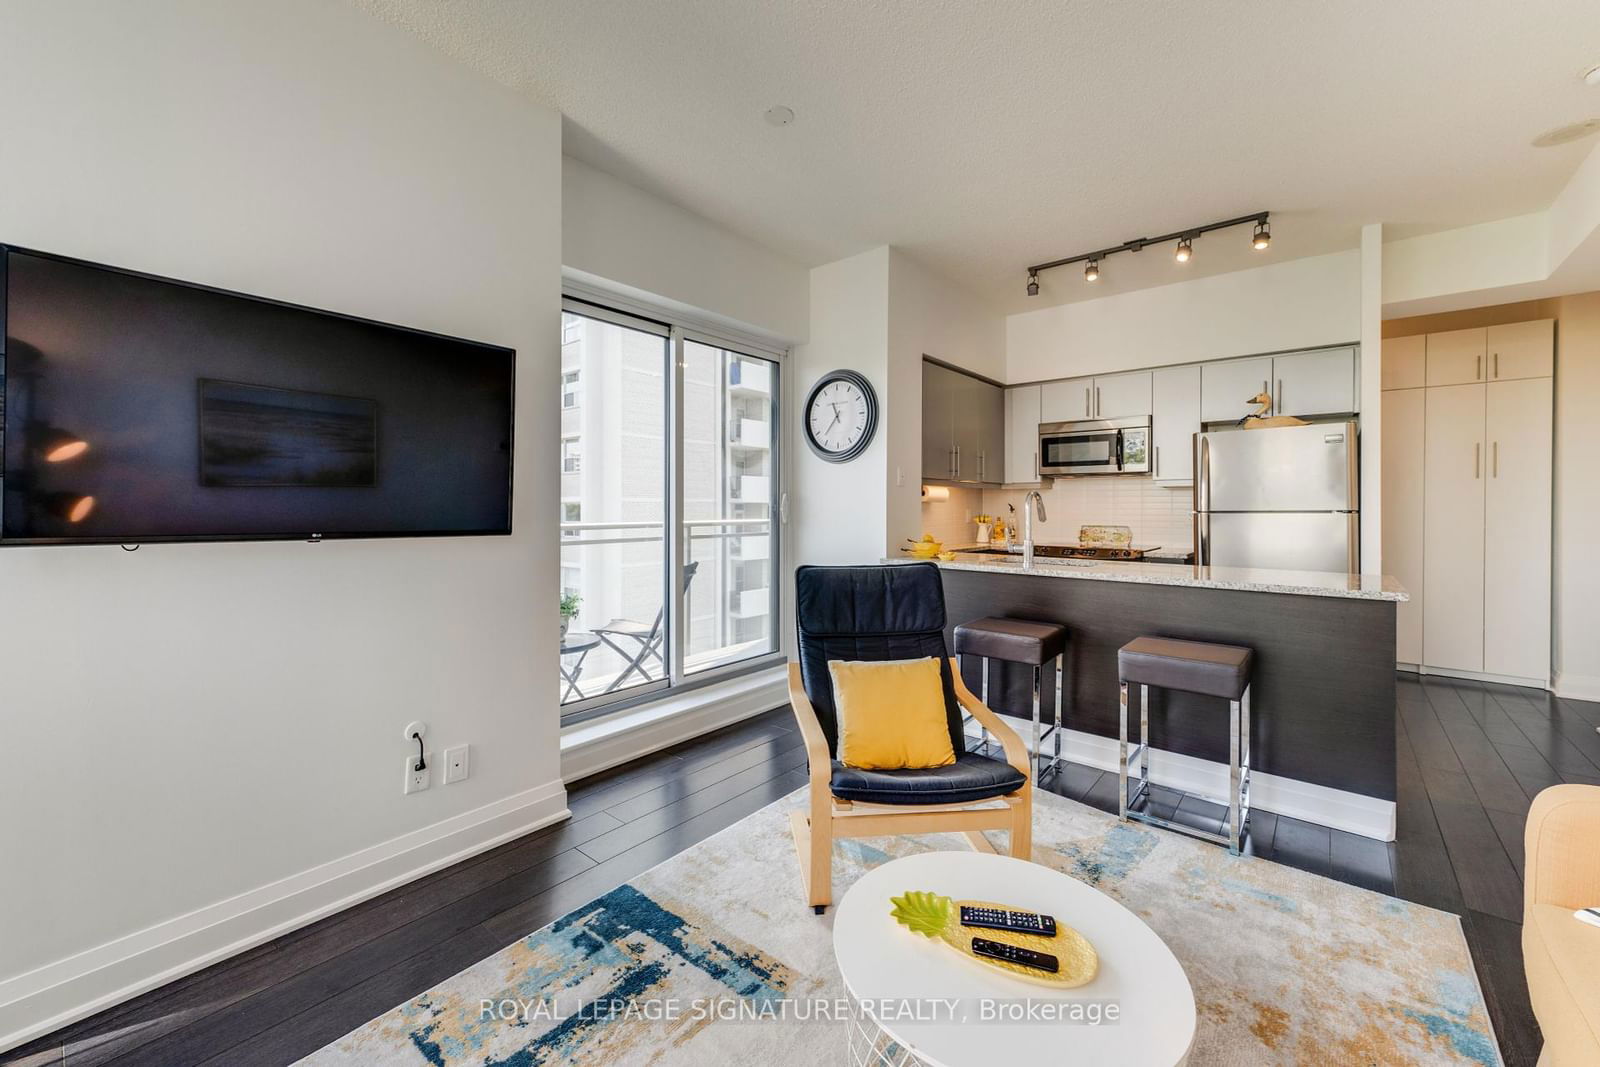
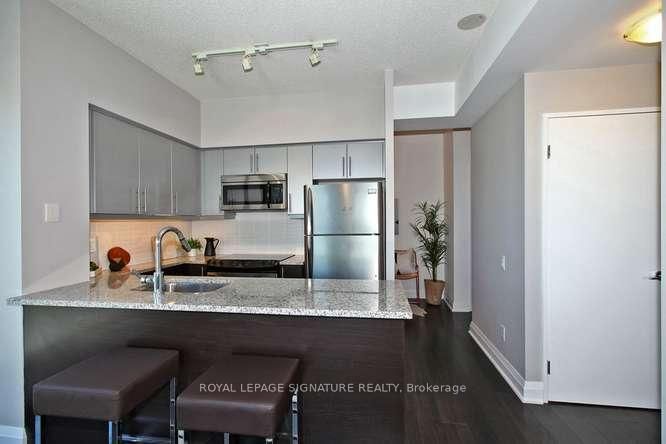
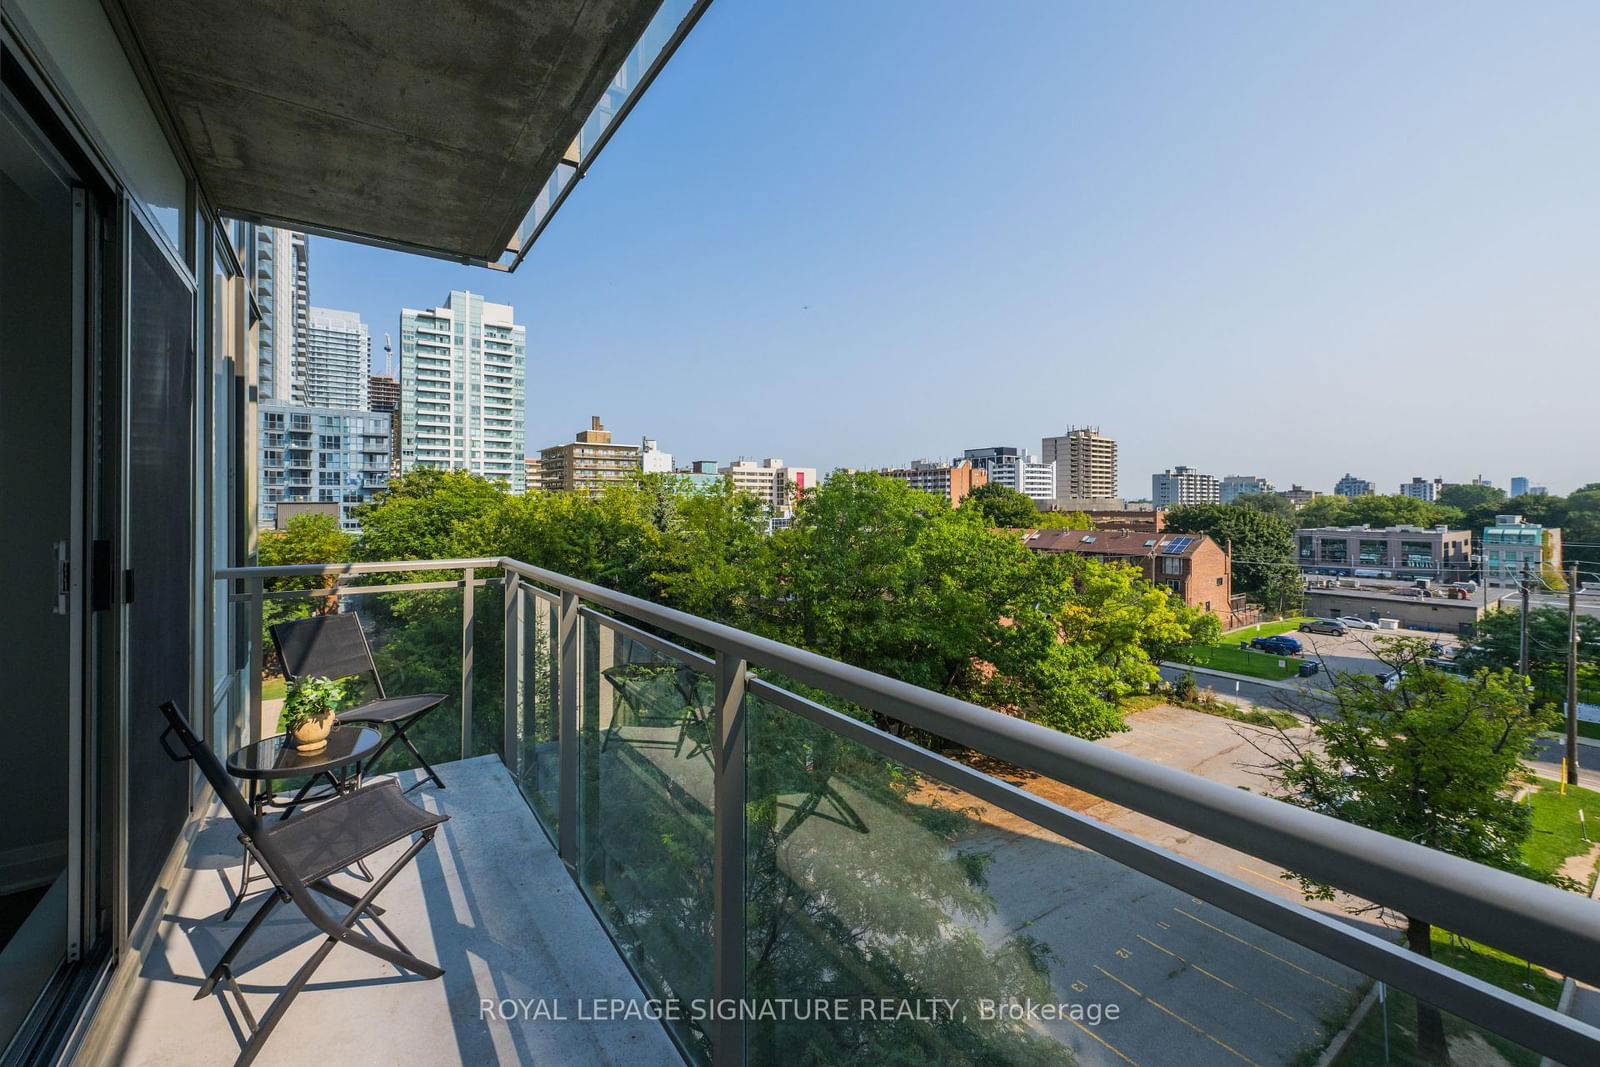
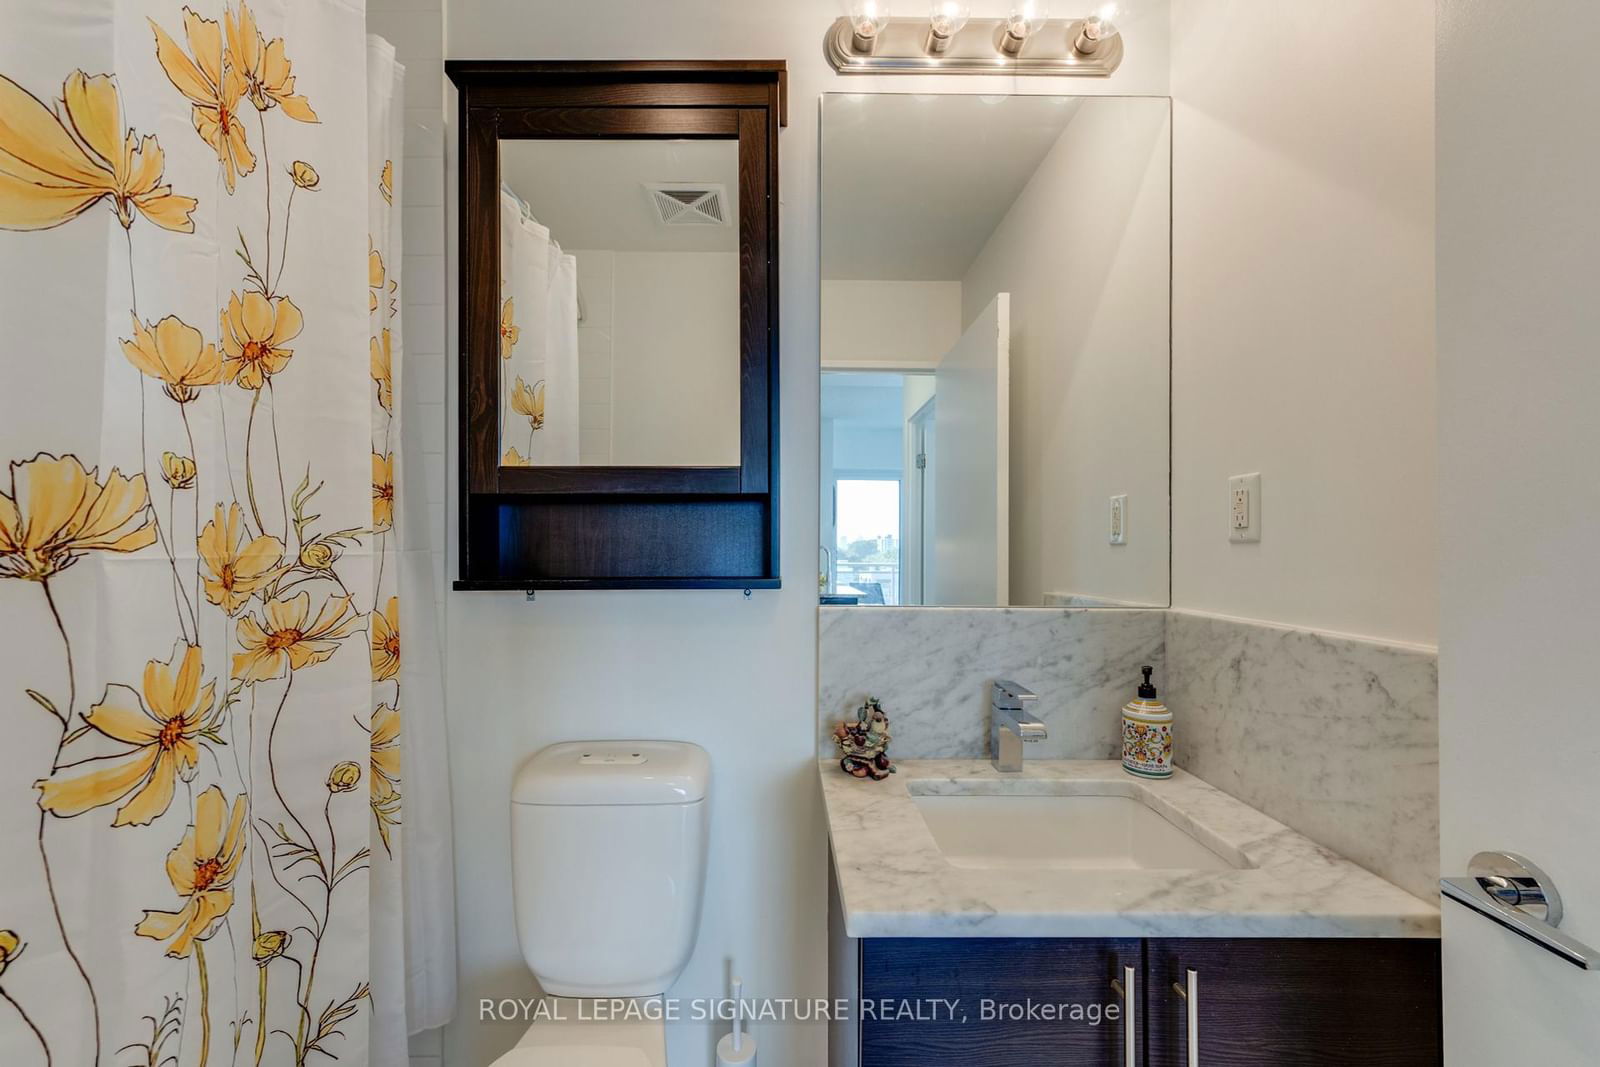
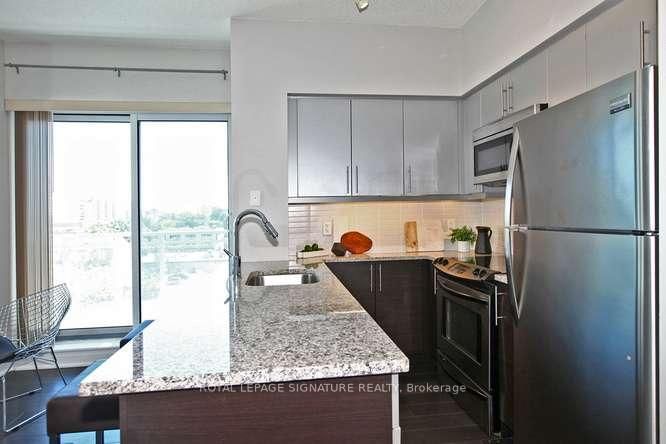
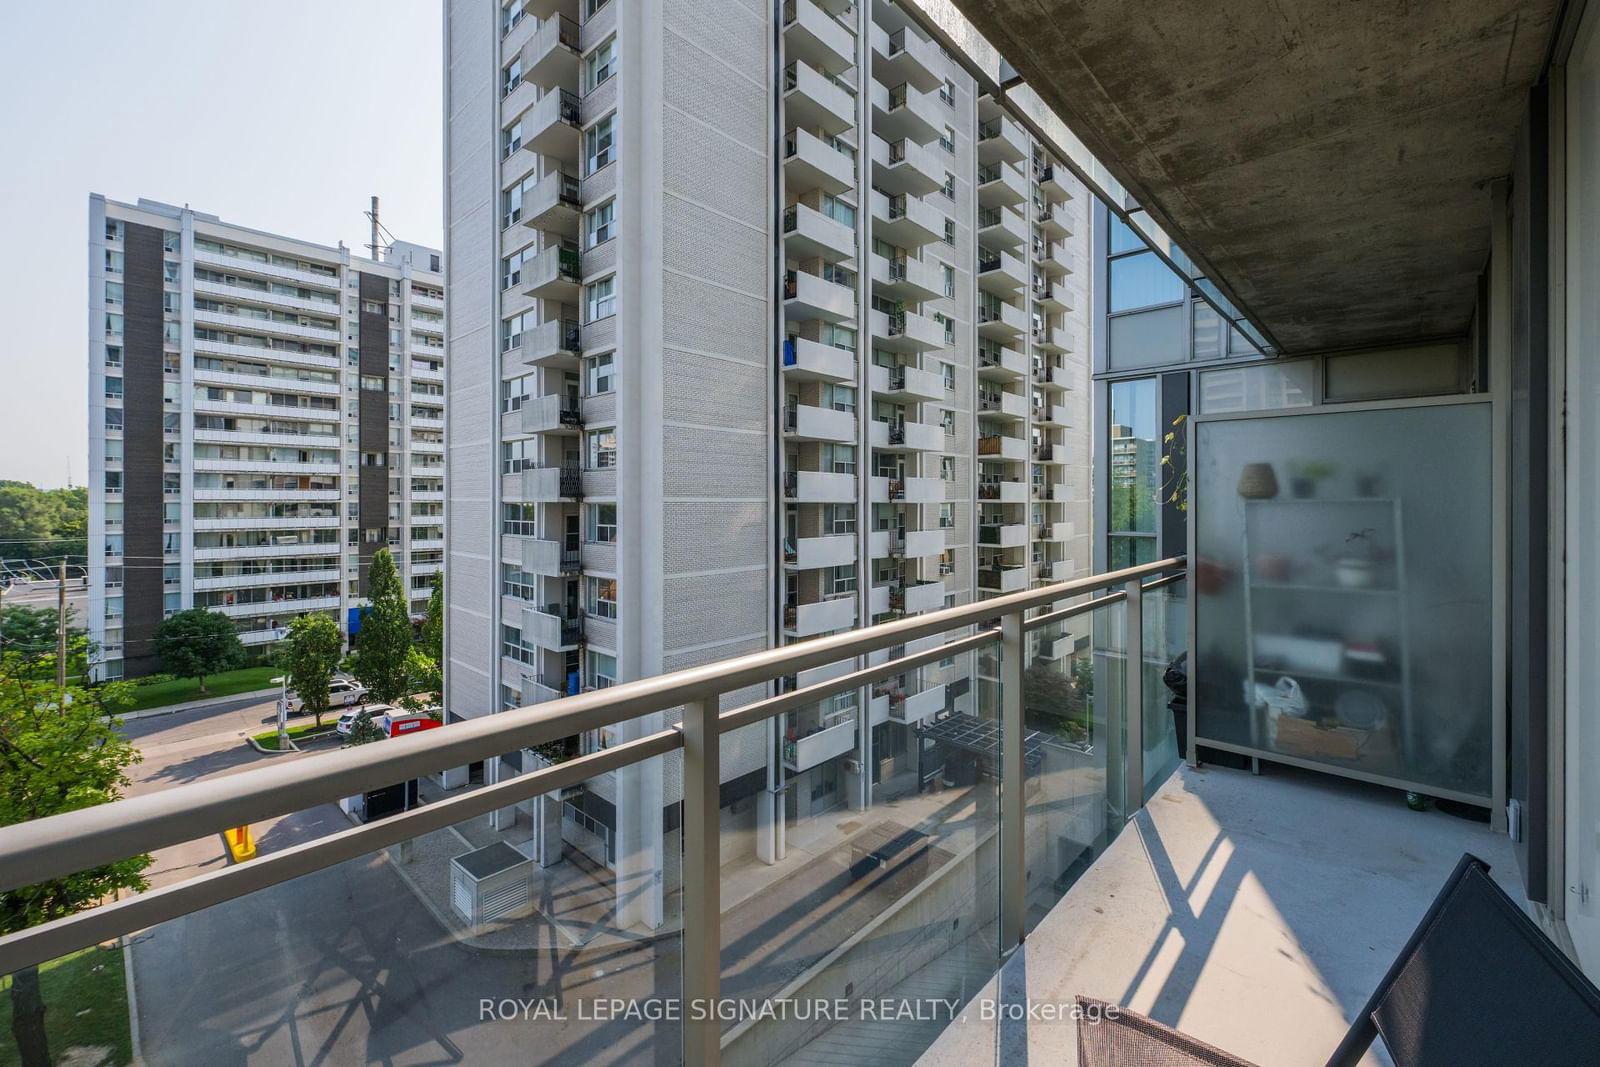
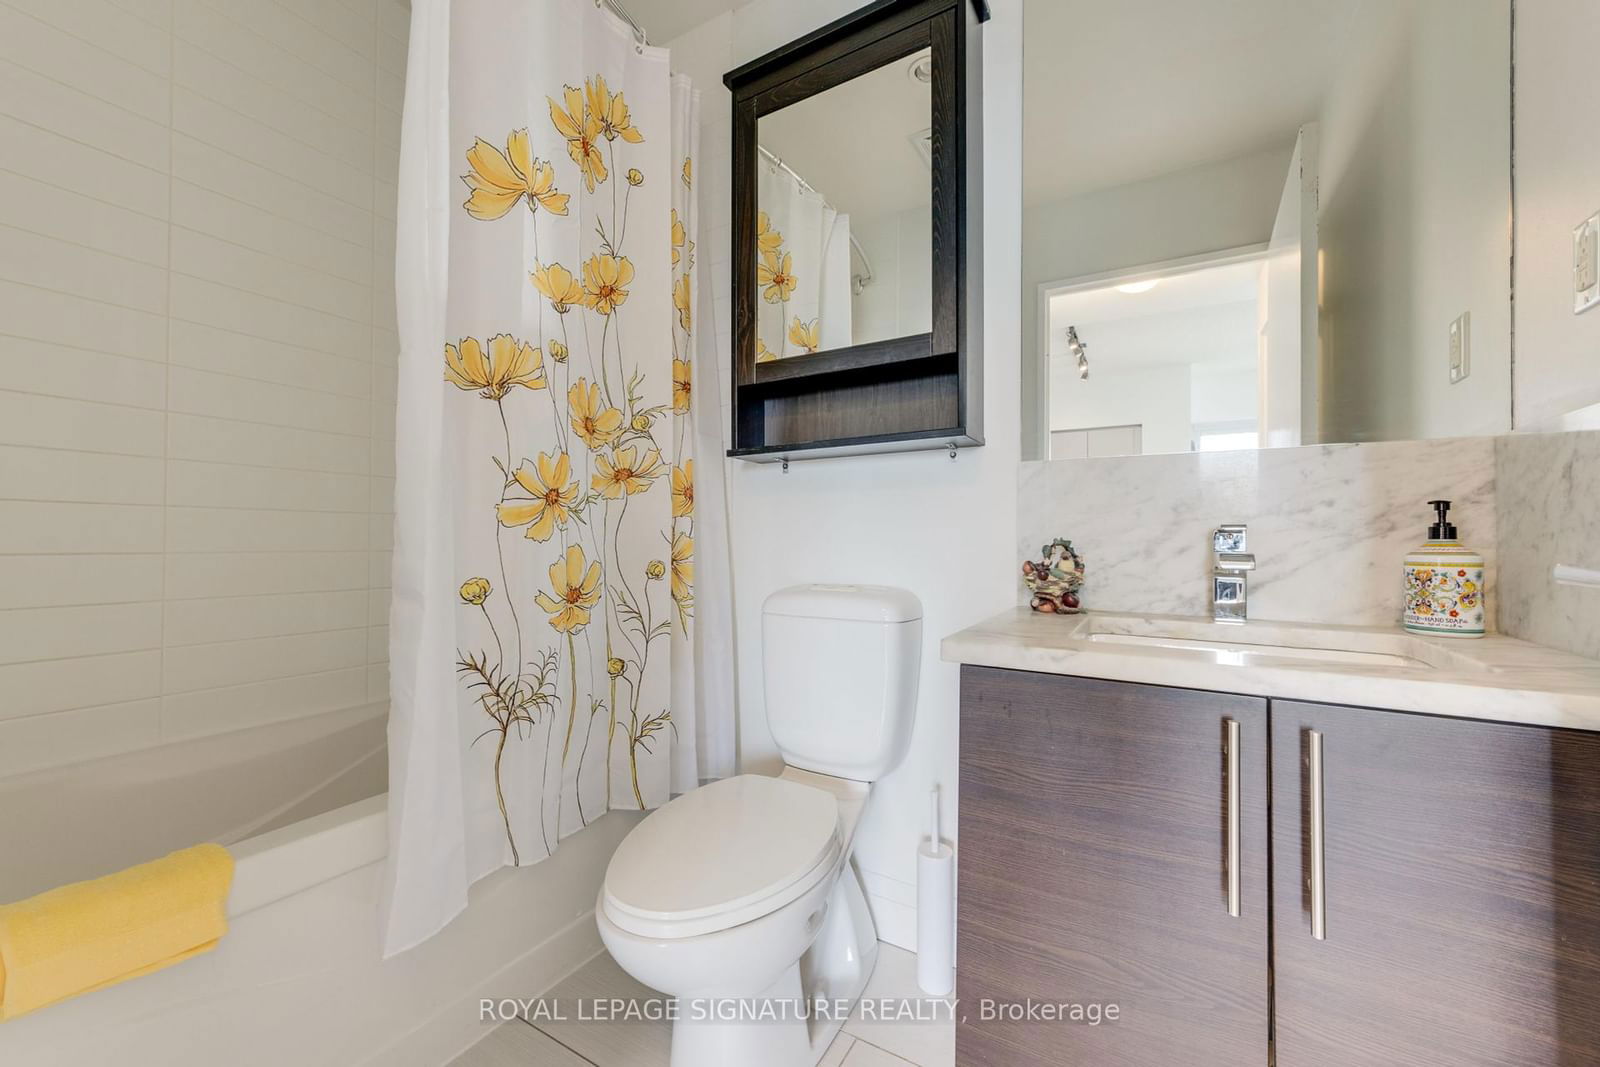
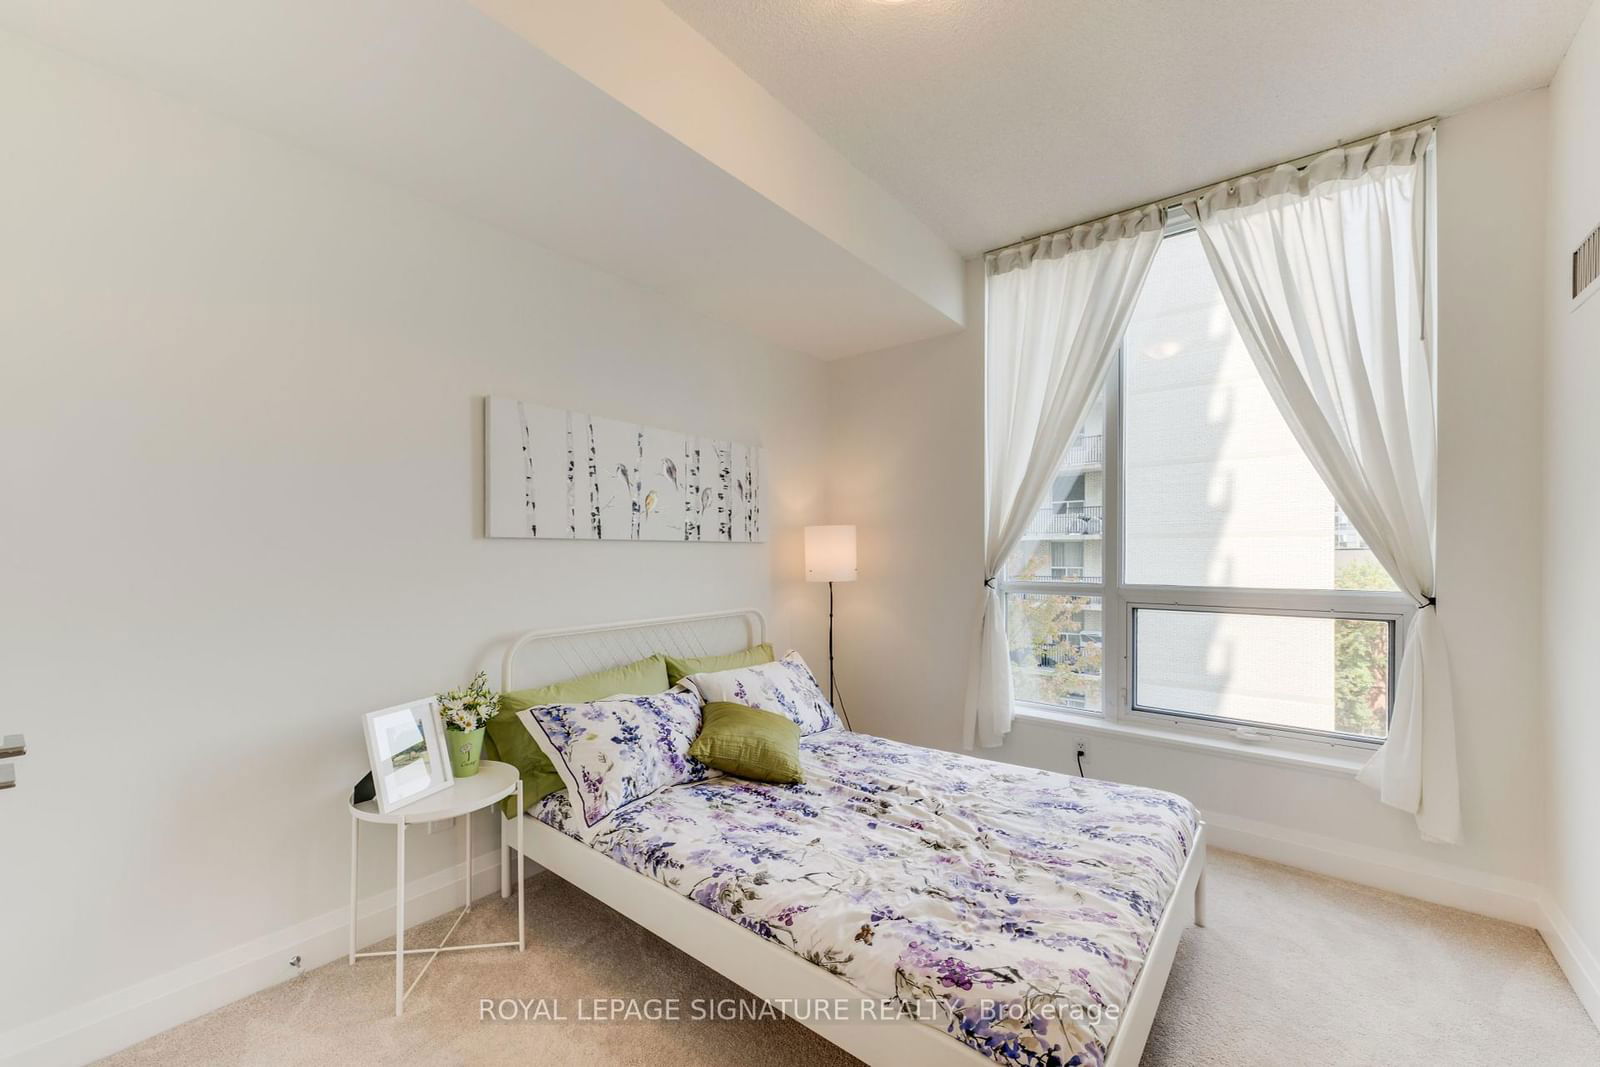
Fall In The City @ 83 Redpath, One Of The Neighbourhood's Favourite Boutique Condominiums! This Bright Corner Unit Features 622 Square Feet Of Functional Living Space, 9 Ft Ceilings, Oversized Balcony All Within A Quick Stroll To The Shops And Cafes Of Yonge Street And TTC ! Freshly Painted and Spotless! Excellent Amenities Include, Roof Top BBQ Deck, Hot Tub, Gym With A Skyline View, Theatre, Half Basketball Court And Concierge! Very Well Managed Community In A Great Neighbourhood!*****Quick Posession Possible! *** Open House Sat Jan 4th 2-4pm***
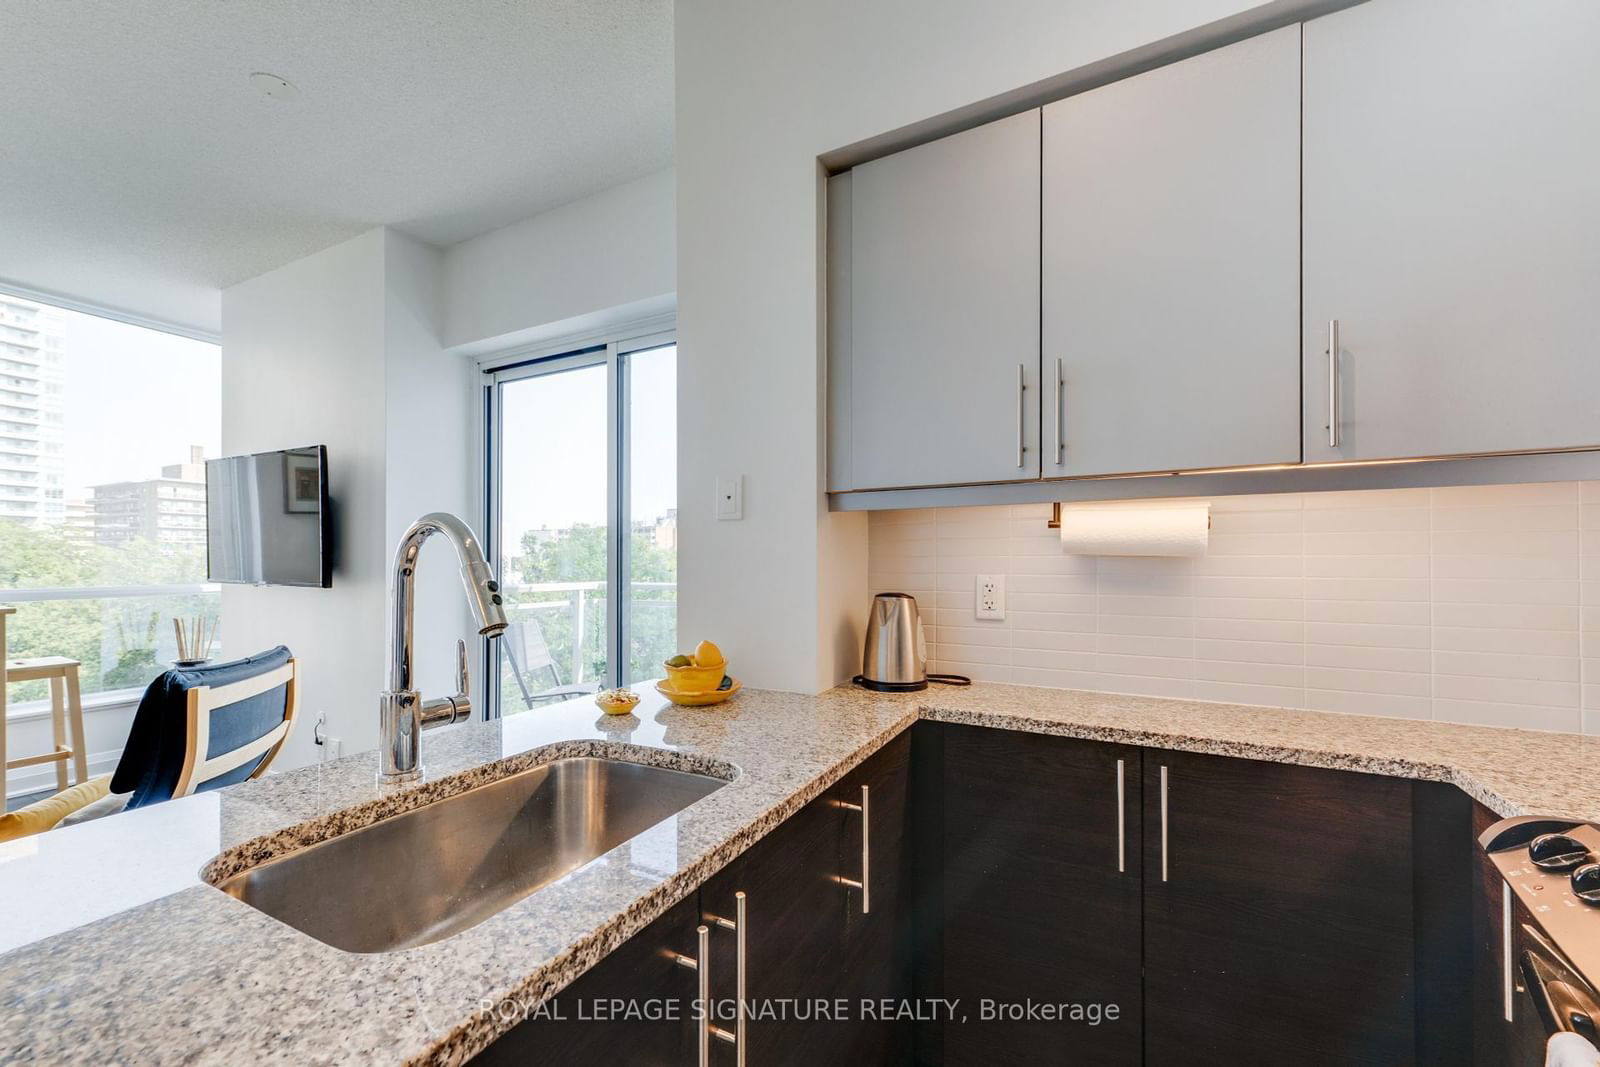
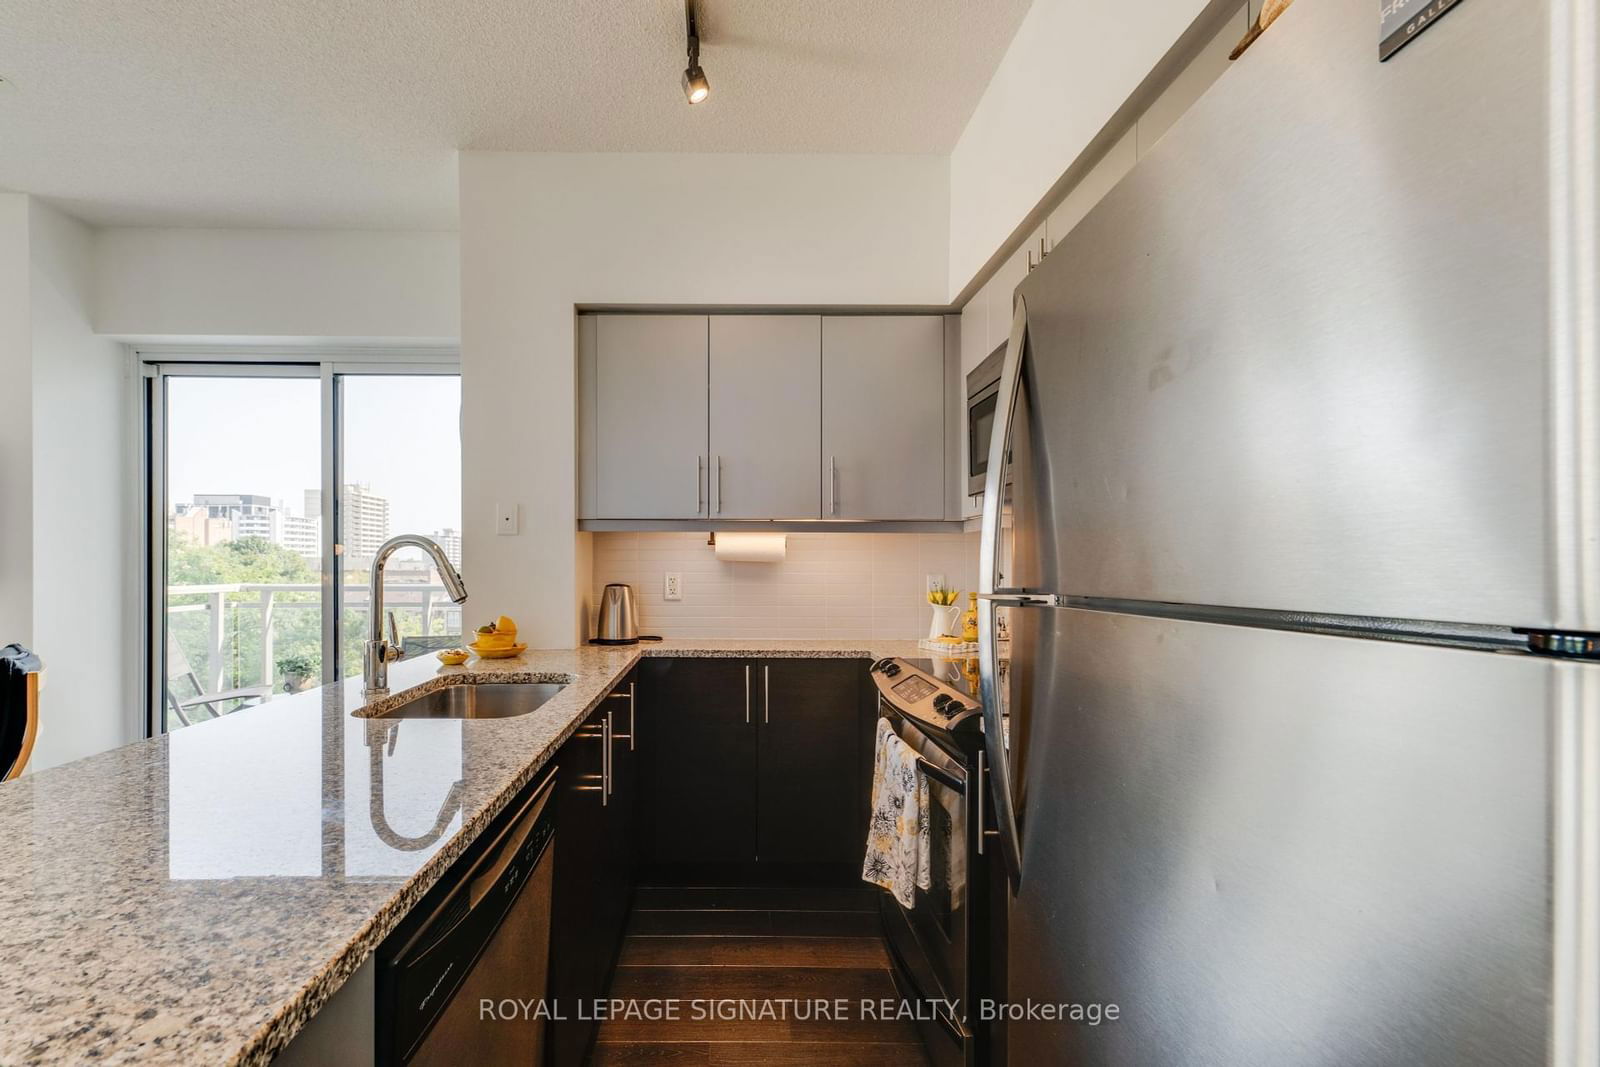
ExtrasStainless Steel Fridge, Stove, B/I Dishwasher, B/I Micowave,Stacked Washer & Dryer, All Electric Light Fixtures, All Window Cvngs, Fan Coil Unit (2019)*** Parking And Locker!!*** Walk To TTC And Everything Yonge And Eg! Move In This Month!
royal lepage signature realtyMLS® #C9350019
Amenities
Explore Neighbourhood
Similar Listings
Demographics
Based on the dissemination area as defined by Statistics Canada. A dissemination area contains, on average, approximately 200 – 400 households.
Price Trends
Maintenance Fees
Building Trends At 83 Redpath Residences
Days on Strata
List vs Selling Price
Offer Competition
Turnover of Units
Property Value
Price Ranking
Sold Units
Rented Units
Best Value Rank
Appreciation Rank
Rental Yield
High Demand
Transaction Insights at 83 Redpath Avenue
| 1 Bed | 1 Bed + Den | 2 Bed | 2 Bed + Den | 3 Bed | 3 Bed + Den | |
|---|---|---|---|---|---|---|
| Price Range | No Data | $575,000 - $620,000 | $875,000 | $861,000 - $1,111,000 | No Data | No Data |
| Avg. Cost Per Sqft | No Data | $946 | $991 | $964 | No Data | No Data |
| Price Range | $2,200 - $2,700 | $2,250 - $2,850 | $3,450 - $3,600 | $3,100 - $4,200 | No Data | No Data |
| Avg. Wait for Unit Availability | 281 Days | 37 Days | 300 Days | 112 Days | 1079 Days | No Data |
| Avg. Wait for Unit Availability | 73 Days | 26 Days | 305 Days | 135 Days | No Data | No Data |
| Ratio of Units in Building | 15% | 56% | 8% | 20% | 3% | 1% |
Transactions vs Inventory
Total number of units listed and sold in Mount Pleasant West
